
利用最小水分限制范围评价东北黑土区免耕和垄作的土壤水分稳定性_刘淑珍
第 36 卷 |
第 10 期 |
农 业 工 程 学 报 |
Vol.36 No.10 |
|
2020 年 |
5 月 |
Transactions of the Chinese Society of Agricultural Engineering |
May 2020 |
107 |
利用最小水分限制范围评价东北黑土区免耕和垄作的土壤水分稳定性
刘淑珍,高伟达※,任图生
(中国农业大学土地科学与技术学院,北京 100193)
摘 要:为明确耕作方式对黑土土壤水分稳定性的作用,提高黑土区雨养农业对气候变化的适应性,该研究基于黑土区长期免耕定位试验,利用最小水分限制范围(Least Limiting Water Range, LLWR)评价免耕(NT)和垄作(CT)管理下土壤含水率有效性及其变异特征。结果表明:1)在 0~5、>5~10、>10~20 和>20~40 cm 4 个土层中,NT 处理显著降低了>5~10 cm 的LLWR,其他 3 个土层LLWR 差异均不显著;2)在平水年(2014)、枯水年(2015)和丰水年(2016), NT 管理下作物生育期内 0~40 cm 平均土壤含水率正常率分别为 48%、72%和 85%,年间变异系数为 0.23;CT 的土壤含水率正常率分别为 56%、20%和 51%,年间变异系数为 0.38;3)在丰水年,NT 与 CT 的平均有效储水量差值最小,NT 比 CT 高 8.95 mm;在枯水年相差最大,NT 的平均有效储水量比 CT 高 13.99 mm。因此,NT 管理下土壤水分更稳定地分布在LLWR 内,在极端降雨年份(枯水年和丰水年)优势尤其明显。
关键词:土壤;耕作;含水率;免耕;降雨年型;最小水分限制范围
doi:10.11975/j.issn.1002-6819.2020.10.013
中图分类号:S152.7 文献标志码:A 文章编号:1002-6819(2020)-10-0107-09
刘淑珍,高伟达,任图生. 利用最小水分限制范围评价东北黑土区免耕和垄作的土壤水分稳定性[J]. 农业工程学报, 2020,36(10):107-115. doi:10.11975/j.issn.1002-6819.2020.10.013 http://www.tcsae.org
Liu Shuzhen, Gao Weida, Ren Tusheng. Evaluating the stability of black soil water content in Northeast China under no tillage and ridge tillage using least limiting water range[J]. Transactions of the Chinese Society of Agricultural Engineering (Transactions of the CSAE), 2020, 36(10): 107-115. (in Chinese with English abstract) doi:10.11975/j.issn.1002-6819.2020.10.013 http://www.tcsae.org
![]()
![]()
![]()
0 引 言
土壤水分是农业生产以及生态水文过程的关键要素[1]。在雨养农业区,土壤水分主要来源于降雨,但降雨在年际与年内分布往往存在很大变异[2],从而影响作物产量的稳定性[3]。同时,土壤水分的时间变异也会通过改变土壤通气性和热量条件而间接影响作物产量[4]。因此,土壤含水率高低及其时间变异性对农业生产有重要影响。
耕作管理影响土壤结构,从而改变水分入渗和土壤持水特性[5],进而引起土壤水分的时空分布差异[6-8]。免耕是保护性耕作的一种,关于免耕对土壤水分影响的研究已有许多。冯倩倩等[9]的研究表明,相比于传统耕作, 免耕能有效地增加 0~20 cm 土层的含水率。贺建华等[10] 对 8 种不同轮耕模式对土壤水分影响的研究显示,深松- 免耕-深松模式下土壤水分条件最优。由于试验时间较短, 该研究未虑不同降雨条件下结果的差异。Wang 等[11]研究了西北地区不同降雨年型下耕作方式对播种前土壤储水量的影响,其表明,与传统耕作相比,包含免耕的轮耕
![]()
收稿日期:2020-01-09 修订日期:2020-03-28
基金项目:国家自然科学基金(41701244);国家重点研发计划项目子课题:松嫩平原区基于合理耕层构造的全程机械化保护性耕作技术体系
(2016YFD0300804-3)
作者简介:刘淑珍,主要从事农田土壤水分方面研究。Email: lsz@cau.edu.cn
※通信作者:高伟达,博士,副教授,博士生导师,主要从事土壤物理方面研究。Email:weida_gao@cau.edu.cn
在枯水年和丰水年储水量有较大提升,在正常年则差异不大。显然,探讨不同降雨年型下土壤水分的动态变化有助于深入认识耕作方式对土壤水分动态的影响规律。大部分研究集中在对土壤含水率或总储水量的探讨,对于水分条件在生长期内动态变化关注较少。Whalley 等[12] 研究了不同质地土壤上土壤强度与作物产量之间的关系,发现不论何种质地,土壤强度都是限制作物产量的重要因素之一。Ren 等[13]在华北平原的研究表明免耕管理下土壤容重及穿透阻力增加,阻碍了玉米根系的生长, 降低了根系干物质量。Gao 等[14]在东北黑土区上的试验结果表明免耕管理下容重增加,并导致土壤穿透阻力增加。一般情况下,土壤紧实度与土壤容重都和含水率具有负相关关系,因此,随着含水率动态变化,作物生长发育过程中还可能受到氧气胁迫和土壤强度的影响[15], 单纯通过含水率来分析耕作方式对土壤水分的影响存在一定的局限性。
土壤有效含水率可以作为评价土壤质量的一个指标。通常认为,田间持水量与萎蔫含水率之间水分范围是可以被作物利用的有效水分,但该定义忽略了集约种植下土壤可能对作物产生的生理限制。有研究发现,即使土壤含水率没有降低到萎蔫含水率,作物产量也会减少[16],表明在田间持水量与萎蔫含水率之间,土壤水分的有效性并不相同。Da Silva 等[17]提出了最小水分限制范围(Least Limiting Water Range,LLWR)理论,综合考虑了土壤有效水、通气状况和土壤强度对作物生长发育
![]()
![]()
![]()
![]()
的影响。有研究表明,最小水分限制范围与作物产量之间有正相关关系[18],可以作为评价农田管理方式对土壤质量影响的综合性指标。
以雨养农业为主的东北黑土区是中国重要的商品粮生产基地。长期集约化种植导致的黑土区土壤侵蚀和退化,黑土层逐渐变薄,土壤有机质含量降低,结构恶化, 持水能力受到影响。近来的研究显示,土壤水分是制约玉米产量的主要因素之一[19]。作为一种保护性耕作技术, 免耕农田地表有秸秆覆盖,土壤侵蚀和地表径流降低, 土壤持水能力增加[8]。因此,在东北黑土区实施保护性耕作对保护黑土、改善土壤水分条件具有很大促进作用。刘继龙等[20]对东北不同耕作方式下土壤水分的研究表明,免耕秸秆覆盖处理下土壤水分特性显著优于传统耕作无覆盖处理。但在东北黑土区同时考虑降雨年型以及耕作方式对土壤水分的影响的研究很少。
本文基于中国农业大学吉林省梨树试验站的长期定位耕作试验,通过定位监测不同降雨年型下土壤含水率动态,并基于最小水分限制范围评价免耕与传统垄作下土壤水分的时空分布及变异特征,为黑土区雨养农业制定应对气候变化的耕作管理措施提供理论依据。
1 材料与方法
1.1 研究区概况与田间试验设计
土壤耕作长期定位试验设在位于吉林省梨树县的中国农业大学吉林梨树试验站。该地属于中温带湿润季风气候区,具有明显的大陆性气候特点。年平均降雨量
577.2 mm,其中 5-9 月份降水量占全年降水量的 82.2%; 年平均气温为 5.8 ℃,≥10 ℃积温平均为 3 078.5 ℃;土壤类型为黑土(Vertisols,USDA)。试验地土壤的质地为粉质黏壤土(0~20 cm 土层的砂粒、粉粒和黏粒含量分别为 23.89%、45.21%和 30.90%)。种植作物为春玉米或大豆。
定位试验开始于 2011 年春季玉米播种前。耕作处理
包括免耕(NT)和垄作(CT)。每个处理有 3 个重复,
随机排列,每个小区面积为 31.5 m× 21.6 m。NT 处理不进行土壤耕作,在作物收获后将秸秆粉碎留在原地,残茬高 20 cm 左右;CT 处理使用旋耕机旋耕>10~15 cm, 然后起垄,在垄上机械化播种、施肥并镇压,作物收获
Scientific Inc., Logan, UT)控制,半小时自动记录一次数据。探头埋设深度分别为 5、10、20 和 40 cm。为了和最小限制水分范围的土层相匹配,用上述 4 个深度的含水率分别代表 0~5、>5~10、>10~20 和>20~40 cm 土层的含水率。
1.2.3 土样采集及测定
样品采集于 2014 年 7 月下旬,在玉米棵间采集原状样品用于测定土壤容重和水分特征曲线。将 0~40 cm 土壤剖面分为 0~5、>5~10、>10~20 和>20~40 cm 4 层, 在每层的中间位置利用环刀(高 5 cm、直径 5 cm,
100 cm3)取样。利用保鲜膜将原状土样品密封,带回实
验室在 105 ℃下烘干 24 h,测定质量并计算土壤容重。
在采集容重样品的同时,利用直径 5.4 cm、高度 1 cm
(22.9 cm3)的环刀采集原状土壤样品以测定水分特征曲线。样品在实验室充分饱和 48 h 后,依次在基质势为 0、
−1、−2、−4、−6、−8、−10 kPa(砂箱)和−100、−300、
−500、−1 500 kPa(压力锅)下平衡,测定质量。最后,
将样品在 105 ℃下烘干 24 h,测定其质量,并计算各基
质势下的含水率。每个耕作处理采集 3 个 100 cm3 和 3 个
22.9 cm3 平行样品,分别测定容重和水分特征曲线。
土壤穿透阻力采用手持式紧实度仪( Field Scout SC900, Spectrum Technologies Inc, Aurora, Colorado, USA)测定,深度为 0~45 cm,每 2.5 cm 记录 1 个读数。每次测定时,各耕作处理重复 3~4 次,然后取平均值, 并将 0~5、>5~10、>10~20 和>20~40 cm 内各深度的数据平均,做为每个土层的穿透阻力。完成土壤穿透阻力测定后,利用土钻采集土壤样品,基于烘干法测定质量含水率。最后,利用容重和质量含水率得到土壤体积含水率。
1.3 数据处理与分析
1.3.1 降雨年型划分
降雨年型划分采用干旱指数法[21]。东北黑土区通常在 5 月上旬播种玉米,10 月初收获。由于 4 月份的降雨
对播种期的土壤含水率有很大影响[22],本文将 4 月至 9 月的总降雨量作为玉米生育期降雨量,并计算干旱指数DI(Drought Index)。DI 小于−0.35 的年份为枯水年, DI 大于 0.35 的为丰水年;否则为平水年。
P M
![]()
![]()
![]()
后,将秸秆移出农田。
DI =
![]() S
S
(1)
结合田间观测情况以及以往的经验,本研究将玉米
生育期划分为播种-拔节期(5 月中旬至 6 月下旬)、拔节-抽穗期(6 月下旬至 7 月中旬)、抽穗-乳熟期(7 月中旬至 8 月下旬)以及乳熟-成熟期(8 月下旬至 9 月下旬)。由于播种日期的差异,每年各生育期的具体日期
式中 DI 为干旱指数,P 为该年生长季降雨量,mm;M 为多年平均生长季降雨量,mm;S 为多年生长季降雨量的标准差。
1.3.2 土壤有效储水量
土壤有效储水量利用下列公式计算得到
略有差异。
1.2 数据来源
W = di i
(2)
1.2.1 降雨量
降雨量数据来源于实验站内距试验地约 30 m 的自动气象站,每 30 min 测定 1 次。
1.2.2 田间土壤含水率
![]() 土壤含水率利用 TDR100(Campbell Scientific Inc.,
土壤含水率利用 TDR100(Campbell Scientific Inc.,
式中 W 为土层有效储水量,mm;di 为第 i 个土层厚度,
mm;θi 为第 i 个土层的有效体积含水率,cm3/cm3。
1.3.3 最小水分限制范围
![]()
![]() 土壤水分特征曲线用 Leao 等 [23]建立的含水率与基质势、容重的关系模型拟合得到:
土壤水分特征曲线用 Leao 等 [23]建立的含水率与基质势、容重的关系模型拟合得到:
Logan,UT)系统测定,由数据采集仪(CR3000,Campbell
exp(a bD ) c
(3)
![]()
![]()
![]()
![]()
土壤的穿透阻力曲线用 Da Silva 等[24]提出的模型进行拟合:
丰水年,4 个平水年。本研究选取 2014(平水年)、2015
(枯水年)和 2016(丰水年)作为代表进行分析。
![]()
![]()
![]()
![]() PR d e D f
PR d e D f
(4)
表 1 2011-2018 年降雨年型
式中 θ 为土壤体积含水率,cm3/cm3;Db 为土壤容重,
g/cm3;ψ 为土壤水基质势,kPa;PR 为穿透阻力,MPa;
Table 1 Rainfall types from 2011 to 2018
![]() 4 月-9 月总降雨量
4 月-9 月总降雨量
年份 Total rainfall from Apr. to
干旱指数
降雨年型
a、b、c、d、e、f 为方程拟合参数。
利用上述模型得到的拟合参数,进一步计算最小水分限制范围涉及的 4 个含水率:
Years
Sept./mm
Drought index Rainfall year type
exp(a bD )10c
(5)
FC b
exp(a bD )1500c
(6)
PWP
b
1
![]() PR e
PR e
![]() PR dD f
PR dD f
(7)
b
1 Db 0.1
![]()
 (8)
(8)
AFP D
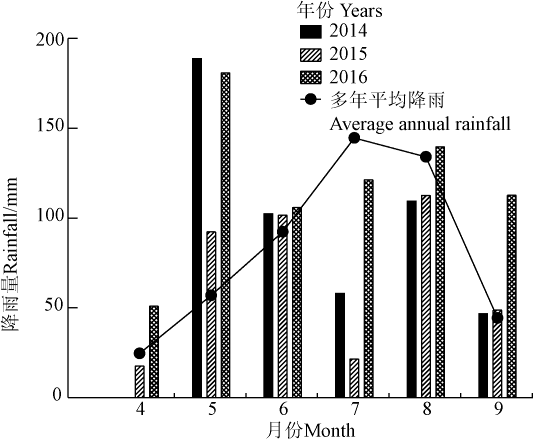
图 1 给出了 3 个年型内玉米生育期的月降雨量分布
S
式中 θFC 代表田间持水率,cm3/cm3;θPWP 代表萎蔫含水率,cm3/cm3;θPR 代表穿透阻力为 2MPa 时的含水率, cm3/cm3 ; θAFP 代表充气孔隙度为 10% 时的含水率, cm3/cm3;DS 为土壤密度,g/cm3。LLWR 的上限为 θAFP 与 θFC 中的较小值,下限为 θPWP 与 θPR 中的较大值;上限和下限之差即为该层土壤的最小限制水分范围。
1.3.4 含水率变异系数
土壤含水率的稳定性通过其变异系数(CV)表征, 其计算公式如下:
情况。2014 年是平水年,但 4 月份没有降雨,5 月份降
雨量为 188.8 mm,是多年平均降雨量的 3.32 倍,而 7 月份降雨量仅为多年平均降雨量的 40%,8 月降雨量为多年平均的 82%,降雨量的变异系数为 0.50。2015 年是枯水年,其中 5 月降水量比多年平均降水量多 62%,但 7 月份的降雨量仅为多年平均降雨量的 15%,变异系数为0.46。2016 年是丰水年,除了 7 月降水量比多年平均降雨量低 16%外,各月份的降雨量都高于多年平均值,其中 5 月份降雨量是多年平均降雨量的 3.18 倍,9 月降雨
CV
(9)
量是多年平均降雨量的 2.54 倍,降雨量的变异系数为
0.20。总体来看,无论何种降雨年型,降雨量在生育期内
式中 σ 为样本的标准差,μ 为样本的平均值。当 CV≤16% 时为弱变异,16%<CV<36%时为中等变异,CV≥36%时为强变异。变异系数越小,稳定性越好。
1.3.5 土壤水分正常率
本研究假设土壤含水率处于 LLWR 内时为正常状态,定义某生育期水分正常率为该生育期含水率正常天数与总天数之比。本研究中,0~5、>5~10、>10~20 和>20~40 cm 4 个土层的土壤水分正常率的平均值
(MGM)被用来评价 NT 与 CT 处理下 0~40 cm 土壤的水分条件,计算公式如下:
分布很不均匀。
![]() MGM 1 4 GM
MGM 1 4 GM
![]()
(10)
 i
i
i 1
![]() 其中 GM 为每个土层不同生育期内土壤水分正常率的几何平均数,可以用以下公式计算:
其中 GM 为每个土层不同生育期内土壤水分正常率的几何平均数,可以用以下公式计算:
图 1 不同降雨年型下玉米生育期内月降雨量分布
Fig.1 Distribution of monthly rainfall in maize growing season
GM
(11)
under different rainfall year types
式中 xi 为某生育期内土壤含水率的正常率,n 的值为 4。本研究利用SPSS 19.0 和Excel 2010 对数据显著性进
行处理与分析,采用 LSD 法进行同一深度 2 组数据间的差异显著性分析。
2 结果与分析
2.1 玉米生育期降雨量年际与年内变异
依据 1986 年至 2018 年 4 月至 9 月的降雨量,对 2011
-2018 年划分降雨年型(表 1),得到 1 个枯水年,3 个
2.2 两种耕作方式下土壤最小水分限制范围
表 2 为 2 种耕作下不同土层最小水分范围。由表 2 看出,在 0~5 cm 土层,NT 与 CT 管理下 LLWR 的上限均为 θFC,下限均为 θPWP,说明该土层中对作物利用水分的限制主要来自土壤本身的持水能力。在>5~10 cm 土层,NT 管理下 LLWR 上限为 θAFP,下限为 θPR;CT 管理下 LLWR 上限为 θFC,下限为 θPWP,说明在该土层中, NT 管理下作物更容易受到氧气胁迫和穿透阻力胁迫,而CT 管理下作物利用水分的限制来自于土壤本身的持水能
![]()
![]()
![]()
![]()
力。在>10~20 cm 和>20~40 cm 土层,NT 和 CT 的LLWR上限均为 θAFP,下限均为 θPR,表明在 20 cm 以下,作物生长过程中更容易受到由于水分过多引起的氧气胁迫, 或者由于土壤较紧实导致的根系生长限制。
在 0~5、>10~20 cm 以及>20~40 cm 土层 NT 和CT 的 LLWR 均无显著差异(P>0.05);在>5~10 cm 土层,NT 和 CT 的 LLWR 分别为 0.08 和 0.16 cm3/cm3,NT 显著小于 CT (P<0.05)。
![]()
![]()
![]()
表 2 免耕(NT)与垄作(CT)管理下不同深度土层最小限制水分范围
 Table 2 Least limiting water range of different soil layers under no tillage (NT) and ridge tillage (CT) management
项目Items
注:不同字母代表同一土层数据差异显著(P<0.05)
Note: Different letters indicate that the data are significantly different from the data in the same soil layer (P<0.05).
2.3 田间水分动态及其时间变异性
图 2 展示了不同降雨年型下 2 种耕作处理下不同土层日平均土壤含水率动态变化。在不同降雨年型下 NT 与CT 土壤剖面上的水分分布具有较大的差异。进一步,本文分析了 2014-2016 年玉米生长季内不同深度土层的平均含水率及其变异性情况(图 3)。总体上,80%的土壤含水率处在 0.25~0.35 cm3/cm3 区间,20%的平均土壤含
水率小于 0.25 cm3/cm3。其中,NT 的平均含水率全部高于 0.25 cm3/cm3 且大部分(83%)情况下时间变异性小于0.16,处于中等变异区间的仅有 17%的数据。对于 CT 管理,仅有 33%的含水率数据处在弱变异区间,67%的数据处在中等变异区间;同时,CT 中 50%的平均土壤含水率小 0.25 cm3/cm3,且变化范围较大。
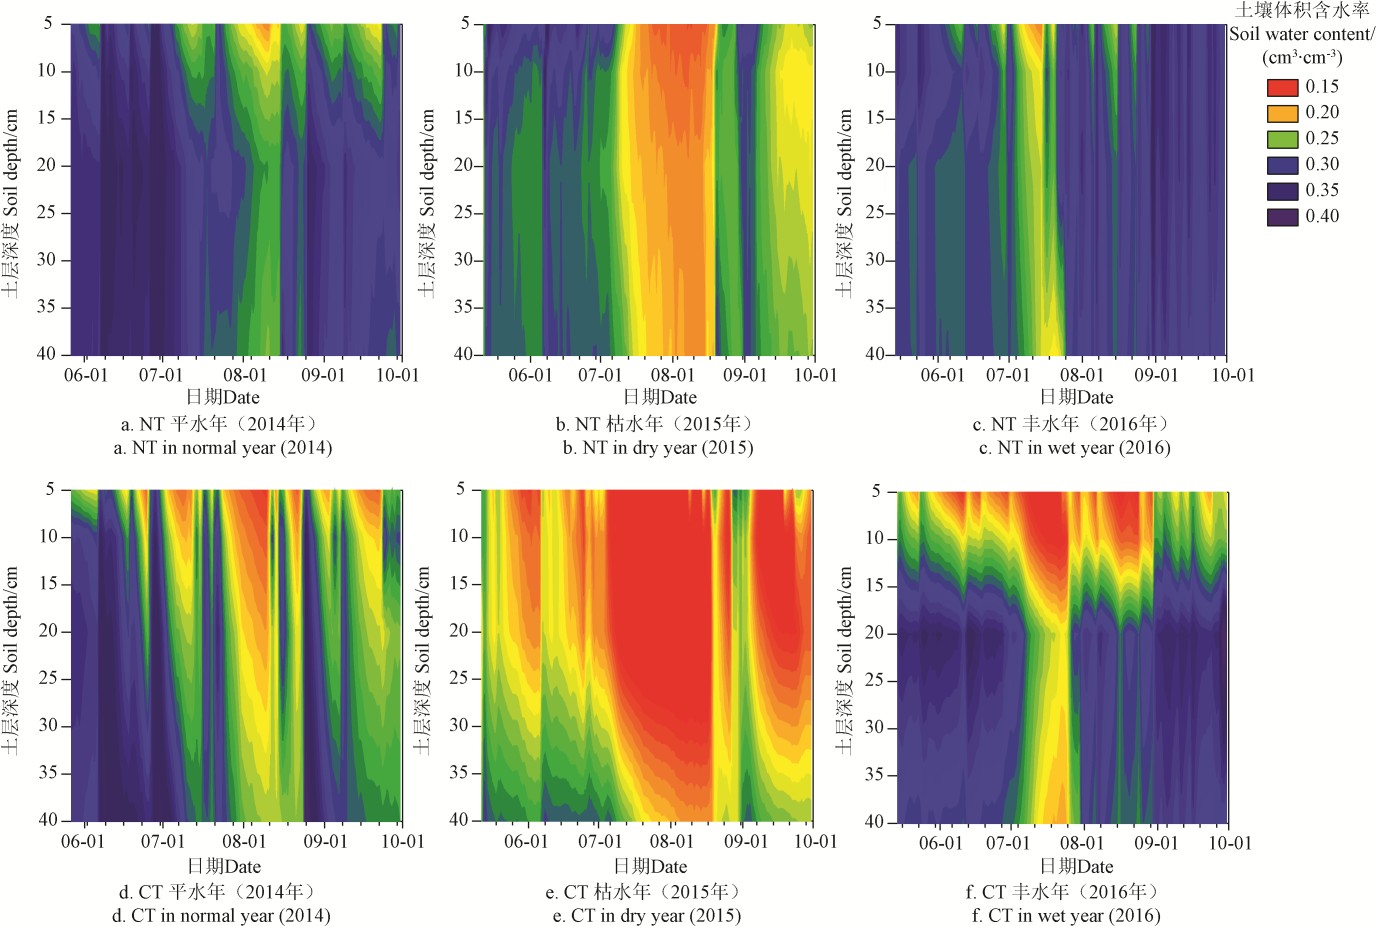
图 2 3 种降雨年型下生育期内免耕与垄作处理的土壤剖面体积含水率
Fig.2 Water content of soil profile of no tillage and ridge tillage management in three rainfall year types
![]()
![]()
![]()
![]()
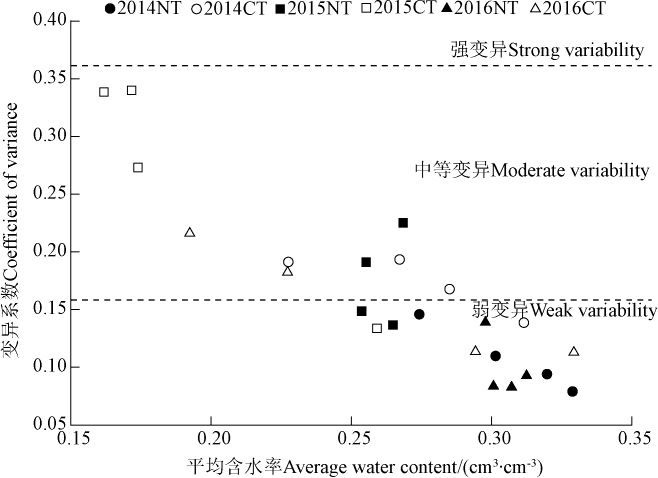
图 3 免耕(NT)与垄作(CT)管理下 3 种降雨年型内含水率的均值与时间变异性
Fig.3 Averages soil water content of different depths and their coefficient of variation of NT and CT treatments in three rainfall year types
2.4 3 种降雨年型下玉米生育期水分正常率
表 3 给出了 3 个降雨年型下玉米不同生育期 4 个土层土壤含水率的正常率。NT 管理下水分正常率出现低于10%的时期为 2014 年的播种-拔节期,主要此阶段较高的
降雨量,导致>10~20 和>20~40 cm 土壤含水率超过LLWR 上限(θAFP)。CT 管理下水分正常率低于 10%的频率较多,且主要发生在>10~20 和>20~40 cm 土层。除了与 NT 处理相同的时期外,2015 年枯水年,由于含水率低于 LLWR 的下限(θPR),CT 在各个生育期都出现了水分正常率小于 10%的情况;2016 丰水年,由于含水率高于 LLWR 上限(θAFP),CT 管理下>10~20 cm 土层在播种-拔节期和乳熟-成熟期出现水分正常率低于10%。
图 4 是 3 种降雨年型下 2 种耕作处理 0~40 cm 土壤水分的平均正常率(MGM,Mean Normal Rate)。在 2014, 2015 和 2016 年,NT 的 MGM 分别为 48%、72%和 85%, MGM 的年际间变异系数为 0.23;CT 的 MGM 分别为56%、20%和 51%,MGM 的年际间变异系数为 0.38,显著高于 NT。显然,实施 NT 后能够降低土壤含水率的变异,并且在不同的降雨年型下保持根层土壤水分处于相对适宜的范围内,其中,在枯水和丰水年,NT 的 MGM 分别是 CT 的 3.63 和 1.66 倍,水分条件明显优于 CT。
综上所述,NT 管理的水分条件在不同降雨条件下更稳定,能够使含水率经常保持在适宜作物生长的范围内, 而 CT 管理容易在极端天气(如干旱或多雨时期)出现不利于作物生长的水分条件。
![]()
![]()
![]()
表 3 2014 至 2016 年免耕(NT)与垄作(CT)下玉米各生育期不同深度土壤含水率正常率
Table 3 Normal rates of soil water content in different soil layers during different maize growth periods under NT and CT in 2014-2016
![]() %
%
年份 生育阶段
NT CT
 2014
2014
2015
2016
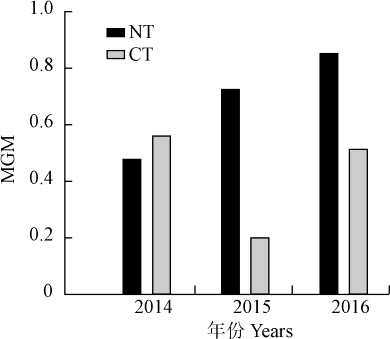
图 4 2014、2015 和 2016 年免耕(NT)与垄作(CT)0~40 cm
土层土壤含水率平均正常率(MGM)
Fig.4 Mean normal rates (MGM) of soil water content in 0-40 cm soil profile under NT and CT in 2014, 2015 and 2016
2.5 不同降雨年型下土壤有效储水量
不同降雨年型下 2 种耕作方式 0~40 cm 土层的有效储水量存在显著差异(图 5)。在 2014 年,NT 和 CT 管理0~40 cm 土层的有效储水量分别为41.52 和30.15 mm。玉米作物生育期的大部分时间内,NT 的有效储水量均高于 CT。另外,NT 和 CT 有效储水量的变异系数分别为
0.28 和 0.52,NT 为中等变异,而 CT 为强变异。在 2015 年,4 月初 14.4 mm 降雨后的 27 d 里只有 4 次降雨,总降雨量 6.6 mm。在这段时期,NT 管理地表有秸秆覆盖, 蒸发量较小,导致其 5 月份的有效水储量高于 CT。在 7 月,经历了 21 d 的干旱后,NT 与 CT 的 0~40 cm 土层有效水储量均逐渐接近 0。此后 20 d 内,有效降雨量较
![]()
![]()
![]()
![]()
少,对有效储水量影响不大。总体来看,在偏旱的 2015 年,NT 和 CT 在玉米生长季的有效储水量分别为 22.33 和 8.34 mm,变异系数都为 0.68,属于强变异性。在 2016 年,4 月份降雨多且频率较大,导致 NT 和 CT 在 5 月的有效储水量比较接近;随着降雨补给的增多,CT 的有效储水量略低于 NT。在 2016 年玉米生长季,NT 和CT 有效储水量的平均值分别为 39.14 和 30.19 mm,变异系数分别为 0.28 和 0.40,NT 为中等变异,CT 为强变异。
综上所述,在枯水年里,NT 与 CT 的平均有效储水量相差最多,NT 比 CT 高 13.99 mm;在丰水年里 NT 与CT 的平均有效储水量相差最少,NT 比CT 多 8.95 mm。
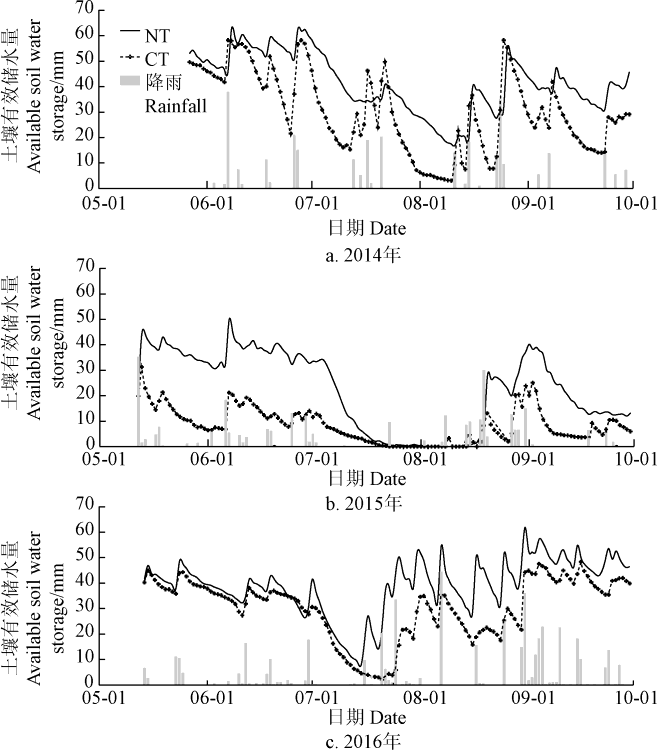
图 5 2014、2015 和 2016 年免耕(NT)和垄作(CT)0~40 cm
土壤有效储水量动态变化
Fig.5 Dynamic changes of available soil water storage in 0-40 cm soil layer under NT and CT treatments in 2014, 2015 and 2016
3 讨 论
3.1 耕作方式对最小水分限制范围的影响
作为一个评价土壤物理质量的综合指标,LLWR 受容重影响很大。有研究表明,容重越大,LLWR 越小[25]。本研究中,NT 的容重在 0~10 cm 土层中显著高于 CT, 但只有 5~10 cm 土层中 NT 的 LLWR 显著小于 CT,在其他土层中,NT 与CT 的LLWR 无显著差异,这与Guedes等[26]的研究结果一致。Guedes 等[26]的结果还显示,在 5~ 10 cm 土层中,翻耕与免耕处理下LLWR 上限均为 θAFP, 下限均为 θPR。而本文 NT 的结果与之一致,但 CT 在 5~ 10 cm 土层的LLWR 上限为 θFC,下限为 θPWP,这可能与耕作强度有关。Gražina 等[27]研究了直接播种、耙松至 8~ 10 cm 深以及犁到 20 cm 深 3 种耕作强度对作物根系的生长限制。结果表明,耕作强度较小时作物根系会受到较
高穿透阻力。在本研究中,CT 处理采用机械旋耕,耕作深度约 15 cm,耕作强度较大。Maurício 等[28]研究表明, 土壤耕作在短期内会带来好处,但是长期耕作会由于土壤侵蚀导致持水能力降低进而使土壤退化。这可能是导致本研究中 CT 管理下 5~10 cm 土层上限为 θFC 的原因。另外,免耕对土壤容重的作用依赖于实施年限,所以免耕对LLWR 的作用可能会随着时间而变化。本文中免耕始于2011 年,2014 年是免耕的第四年。Miwa 等[29]的结果表明短期免耕后会使表层土壤显著增加。而长期实施免耕后, 由于表层有机质的累计,会使土壤容重降低[30]。
3.2 耕作处理对土壤含水率及其变异性的影响
耕作方式会影响土壤表面与大气界面的能量和物质交换,从而改变土壤含水率的时空分布[8]。一般地,与传统耕作相比,免耕通过减少土壤扰动降低了土壤中大孔隙比例,增加了小孔隙比例,从而提高了土壤持水性能[31], 在作物生育期保持较高的含水率[9,11]。本研究指出,在 3 种降雨年型下,NT 管理玉米生育期 0~5、>5~10、>10~ 20 和>20~40 cm 土层的平均含水率比 CT 管理分别增加
43%、33%、13%和 2%(图 2);而且NT 管理下水分更稳定,4 个土层含水率的变异系数分别比CT 降低了 35%、 48%、51%和 13%(图 3 和图 5)。
LLWR 表征作物生长过程中受土壤含水率、氧气浓度和穿透阻力影响最小的土壤含水率范围。由于 0~ 40 cm 土层的水分对黑土区作物生长发育具有决定性作用[32],本研究基于 LLWR 指标对 3 种不同降雨年型下NT和 CT 管理 0~40 cm 土层水分条件进行了评价。张晓平等[33]指出,实施免耕使春季黑土土壤含水率显著增加, 有利于出苗和幼苗的健康生长。这与本文研究结果一致, 在 3 种降雨年型下,播种-拔节期,NT 管理下土壤水分正常率均高于 CT 处理(表 3)。从全年角度看,NT 的水分正常率在枯水年和丰水年都高于 CT,(图 4)。NT 管理的秸秆覆盖会对土壤中的水热条件起缓冲作用,减缓土壤中水分蒸发的同时,减缓水分进入土壤,同时,NT 管理下土壤扰动减少,土壤中拥有更多完整的垂直大孔隙[34],容易形成优先流,在降雨量较大时有利于水分下渗[30];在 CT 管理下,虽然耕作增加了耕层的总孔隙度, 耕作层具有较大的入渗率,但由于耕作机具对土壤的压实导致其在 20 cm 左右的深度的孔隙度急剧降低,形成突变层[14],不利于土壤水分向深层次入渗,导致降雨量集中时水分容易滞留在该土层。如在 2016 年,CT 管理下 20 cm 土层土壤含水率较高(图 2),超过 LLWR 上限 θAFP 的次数较多,导致 2016 年 CT 管理下累计水分正常率较低。
不同耕作管理下,作物生育期内降雨量及其时间分布对土壤有效储水量的动态影响不同(图 5)。当长期干旱后发生降雨时,NT 管理 0~40 cm 土层有效储水量的增加量小于 CT 管理(如 2015 年 8 月 8 日),主要是因为免耕表面的秸秆截获了一部分降雨。谭春荐[35]也研究了秸秆对降雨的吸收作用,只有降雨比较频繁时,少量降雨后免耕中的增加的有效储水量才会与垄作相当。总
![]()
![]()
![]()
![]()
![]()
![]()
![]()
的来看,由于 NT 管理下土壤前期有效储水量较高,降雨量较少时,作物受到的水分胁迫比 CT 管理弱。但是,当无降雨的天数超过一定期限后,NT 管理下有效储水量的优势也会消失。
3.3 最小水分限制范围评价土壤水分的局限性
关于 LLWR 作为评价土壤水分对作物生长有效性的指标,目前仍然存在一些争论。一部分研究显示,LLWR 是评价农田管理方式对土壤结构影响的一个有效指标之一,并以此为标准判断整个作物生育期内土壤水分条件是否正常[36]。另外一部分研究者则表明,LLWR 与作物的生长状况之间并没有显著的联系[37]。这些差异可能与LLWR 上限阈值 θAFP 的选取有关。土壤向作物根系供给氧气的能力不仅受充气孔隙度的影响,与气体扩散系数也密切相关[38]。因此,不同质地土壤产生氧气胁迫时的充气孔隙度可能不同,LLWR 中以 θAFP(充气孔隙度为10% 时的含水率) 为上限阈值具有一定的局限性。Siegellissem 等[39]也指出,当土壤充气孔隙度小于 10%时, 作物也可以正常生长。本研究中,在某些生育期内,两种耕作管理下 20~40 cm 土层出现含水率正常率为 0 的情况,尤其是在丰水年(2016),主要原因在于土壤含水率超过了 LLWR 的上限 θAFP。因此,在这种情况下利用 LLWR 指标评价田间作物受到氧气胁迫可能会产生误判。另一方面,传统耕作管理下,耕作后一定时期内土壤容重随着时间呈现增加的趋势[40]。本研究未考虑容重在生育期内的动态变化,在计算 LLWR 时可能会产生一定的误差。
4 结 论
本文以中国农业大学吉林省梨树实验站的长期耕作定位试验为基础,利用时域反射仪(TDR)连续原位监测免耕与垄作管理下不同层次土壤含水率,基于最小水分限制范围(LLWR)评价了免耕与垄作在面对不同降雨年型时土壤水分状况的表现。主要结论如下:
1) 在 0~40 cm 土壤剖面内,与垄作相比,尽管免耕显著增加 0~5 和>5~10 cm 土层土壤容重,但只有>5~10 cm 土层的LLWR 显著减小。
2) 在 3 种降雨年型下,免耕管理下不同土层平均土壤含水率高于垄作管理。另外,两种耕作处理在平水年的平均水分正常率差异不大,但在枯水和丰水年,免耕的平均水分正常率分别是垄作的 3.63 和 1.66 倍,水分条件明显优于垄作。同时,免耕管理平均水分正常率的变异系数为 0.23,而垄作平均水分正常率变异系数为 0.38。
因此,从年际尺度讲,当经历不同降雨年型时,免耕管理下土壤水分变异性更小;在极端降雨频率增加时, 在黑土区采用免耕管理方式可以为作物生长提供良好的水分条件。
[参 考 文 献]
[1] Wu Jingwen, Miao Chiyuan, Tang Xu, et al. A nonparametric standardized runoff index for characterizing hydrological drought on the Loess Plateau, China[J]. Global and Planetary Change, 2018, 161: 53-65.
[2] Deng Shulin, Chen Tan, Yang Ni, et al. Spatial and temporal distribution of rainfall and drought characteristics across the Pearl River Basin[J]. The Science of the Total Environment, 2018, 619: 28-41.
[3] 杨文亭,王晓维,徐健程,等. 施氮量和土壤含水率对红壤区黑麦草腐解和氮素释放的影响[J]. 生态学杂志, 2018,37(9):2589-2595.
Yang Wenting, Wang Xiaowei, Xu Jiancheng, et al. Effects of nitrogen application rates and soil water contents on ryegrass decomposition and nitrogen release in red soil[J]. Chinese Journal of Ecology, 2018, 37(9): 2589-2595. (in Chinese with English abstract)
[4] 崔建平,程强,陈平,等. 深松条件下滴灌频次对土壤理化指标及棉花产量的调节效应[J].水土保持学报,2019, 33(1):263-269, 276.
Cui Jianping, Cheng Qiang, Chen Ping, et al. Effects of drip irrigation frequency on soil physical and chemical characteristics and cotton yields under subsoiling condition[J]. Journal of Soil and Water Conservation, 2019, 33(1): 263-269, 276. (in Chinese with English abstract)
[5] Igor Dekemati, Barbara Simon, Szergej Vinogradov, et al. The effects of various tillage treatments on soil physical properties, earthworm abundance and crop yield in Hungary[J]. Soil and Tillage Research, 2019, 194: 104334.
[6] Wilk Sampaio de Almeida, Elói Panachuki, Paulo Tarso Sanches de Oliveira, et al. Effect of soil tillage and vegetal cover on soil water infiltration[J]. Soil and Tillage Research, 2018, 175: 130-138.
[7] Li Danfeng, Shao Ming’an. Temporal stability of soil water storage in three landscapes in the middle reaches of the Heihe River, Northwestern China[J]. Environmental Earth Sciences, 2015, 73(7): 3095-3107.
[8] Li Xuezhang, Shao Ming’an, Jia Xiaoxu, et al. Depth persistence of the spatial pattern of soil–water storage along a small transect in the Loess Plateau of China[J]. Journal of Hydrology, 2015, 529: 685-695.
[9] 冯倩倩,韩惠芳,张亚运,等. 耕作方式对麦-玉轮作农田固碳、保水性能及产量的影响[J]. 植物营养与肥料学报, 2018,24(4):869-879.
Feng Qianqian, Han Huifang, Zhang Yayun, et al. Effects of tillage methods on soil carbon sequestration and water holding capacity and yield in wheat-maize rotation[J]. Journal of Plant Nutrition and Fertilizers, 2018, 24(4): 869-879. (in Chinese with English abstract)
[10] 贺建华,王平,陈娟,等. 不同轮耕方式对旱作区土壤容重、水分及春玉米产量的影响[J]. 土壤通报,2018,49(2): 415-422.
He Jianhua, Wang Ping, Chen Juan, et al. Effects of different rotational tillage patterns on bulk density and moisture of soil and yield of spring maize (zea mays l.) in arid areas[J]. Chinese Journal of Soil Science, 2018, 49(2): 415-422. (in Chinese with English abstract)
[11] Wang Shulan, Wang Hao, Zhang Yuanhong, et al. The influence of rotational tillage on soil water storage, water use efficiency and maize yield in semi-arid areas under varied rainfall conditions[J]. Agricultural Water Management, 2018, 203: 376-384.
![]()
![]()
![]()
![]()
![]()
![]()
![]()
[12] Whalley W R, Watts C W, Gregory A S, et al. The effect of soil strength on the yield of wheat[J]. Plant and Soil, 2008, 306: 237-247.
[13] Ren Baizhao, Li Xia, Dong Shuting, et al. Soil physical properties and maize root growth under different tillage systems in the North China Plain[J]. The Crop Journal, 2018, 6(6): 669-676.
[14] Gao W, Whalley W R, Tian Z, et al. A simple model to predict soil penetrometer resistance as a function of density, drying and depth in the field[J]. Soil and Tillage Research, 2016, 155: 190-198.
[15] Moacir Tuzzin de Moraes, Henrique Debiasi, Julio Cezar Franchini, et al. Soil compaction impacts soybean root growth in an Oxisol from subtropical Brazil[J]. Soil and Tillage Research, 2020, 200: 104611.
[16] Sterling A. Taylor. Use of mean soil moiture tension to evaluate the effect of soil moisture on crop yields[J]. Soil Science, 1952, 74: 217-226.
[17] Da Silva A P, Kay B D, Perfect E. Characterization of the least limiting water range of soils[J]. Soil Science Society of America Journal, 1994, 58: 1775-1781.
[18] Camila Jorge Bernabé Ferreira, Lincoln Zotarelli, Cássio Antonio Tormena, et al. Effects of water table management on least limiting water range and potato root growth[J]. Agricultural Water Management, 2017, 186: 1-11.
[19] 裴志超,张伟强,周继华,等. 干旱胁迫对不同基因型玉米产量及其构成因素的影响[J]. 玉米科学,2019,27(4): 115-121.
Pei Zhichao, Zhang Weiqiang, Zhou Jihua, et al. Effects of drought stress on yield and yield components of different genotypes in maize[J]. Journal of Maize Sciences, 2019, 27(4): 115-121. (in Chinese with English abstract)
[20] 刘继龙,李佳文,周延,等. 秸秆覆盖与耕作方式对土壤水分特性的影响[J]. 农业机械学报,2019,50(7):333-339. Liu Jilong, Li Jiawen, Zhou Yan, et al. Effects of straw mulching and tillage on soil water characteristics[J]. Transactions of the Chinese Society for Agricultural Machinery, 2019, 50(7): 333-339. (in Chinese with English abstract)
[21] Guo Shengli, Zhu Hanhua, Dang Tinghui, et al. Winter wheat grain yield associated with rainfall distribution under long-term nitrogen fertilization in the semiarid Loess Plateau in China[J]. Geoderma, 2012, 189: 442-450.
[22] 马长健. 秸秆覆盖和播前底墒对夏玉米农田水-碳利用的影响[D]. 泰安:山东农业大学,2016.
Ma Changjian. Effects of Straw Mulching and Soil Water Before Sowing on Water-Carbon Utilization of Summer Maize[D]. Tai’an: Shandong Agricultural University, 2016. (in Chinese with English abstract)
[23] Leao Tairone Paiva, Da Silva Alvaro Pires, Perfect Edmund, et al. An algorithm for calculating the least limiting water range of soils[J]. Agronomy Journal, 2005, 97(4): 1210-1215.
[24] Da Silva Alvaro Pires, Kay B D. Estimating the least limiting water range of soils from properties and management[J]. Soil Science Society of America Journal, 1997, 61(3): 877-883.
[25] Ingrid Nehmi de Oliveira, Zigomar Menezes de Souza, Lenon Henrique Lovera, et al. Least limiting water range as
influenced by tillage and cover crop[J]. Agricultural Water Management, 2019, 225: 1-13.
[26] Guedes Filhoa O, Blanco-Canquib H, da Silvac A P. Least limiting water range of the soil seedbed for long-term tillage and cropping systems in the Central Great Plains, USA[J]. Geoderma, 2013, 207: 99-110.
[27] Gražina Kadžienė, Lars J Munkholm, James K Mutegi. Root growth conditions in the topsoil as affected by tillage intensity[J]. Geoderma, 2011, 166(1): 66-73.
[28] Maurício R Cherubin, Douglas L Karlen, André L C. et al. Soil physical quality response to sugarcane expansion in Brazil[J]. Geoderma, 2016, 267: 156-168.
[29] Miwa Arai, Toshiko Miura, Hiroshi Tsuzura, et al. Two-year responses of earthworm abundance, soil aggregates, and soil carbon to no-tillage and fertilization[J]. Geoderma, 2018, 332: 135-141.
[30] Du Zhangliu, Ren Tusheng, Hu Chunsheng. Tillage and residue removal effects on soil carbon and nitrogen storage in the North China Plain[J]. Soil Science Society of America Journal, 2010, 74:196-202.
[31] Gao Weida, W Richard Whalley, Tian Zhengchao, et al. A simple model to predict soil penetrometer resistance as a function of density, drying and depth in the field[J]. Soil and Tillage Research, 2016, 155: 190-198.
[32] 邹文秀,陆欣春,陈旭,等. 东北黑土区农田土壤水分剖面分布与大气降水关系的研究[J]. 土壤通报,2019,50(2): 267-273.
Zou Wenxiu, Lu Xinchun, Chen Xu, et al. Relationship between distribution of soil water contents within soil profiles and precipitation in farmland of black soil region of Northeast China[J]. Chinese Journal of Soil Science, 2019, 50(2): 267-273. (in Chinese with English abstract)
[33] 张晓平,方华军,杨学明,等. 免耕对黑土春夏季节温度和水分的影响[J]. 土壤通报,2005,3:313-316.
Zhang Xiaoping, Fang Huajun, Yang Xueming, et al. Effects of no-tillage practices on temperature and moisture of a black soil in the spring and early summer[J]. Chinese Journal of Soil Science, 2005, 3: 313-316. (in Chinese with English abstract)
[34] Galdos M V, Pires L F, Cooper H V, et al. Assessing the long-term effects of zero-tillage on the macroporosity of Brazilian soils using X-ray Computed Tomography[J]. Geoderma, 2019, 337: 1126-1135.
[35] 谭春荐. 保护性耕作对坡耕地土壤养分维持及水蚀防控效应研究[D]. 杨凌:西北农林科技大学,2015.
Tan Chunjian, Effects of Conservation Tillage on the Soil Nutrients Maintenance and Control of Water Erosion of Sloping Farmland[D]. Yangling: Northwest A&F University, 2015. (in Chinese with English abstract)
[36] Hossein Asgarzadeh, Mohammad Reza Mosaddeghi, Ali Akbar Mahboubi, et al. Soil water availability for plants as quantified by conventional available water, least limiting water range and integral water capacity[J]. Plant Soil, 2010, 335: 229-224.
[37] Cecagno D, de Andrade Costa S E V G, Anghinoni I, et al. Least limiting water range and soybean yield in a long-term, no-till, integrated crop-livestock system under different grazing
![]()
![]()
![]()
![]()
![]()
![]()
![]()
intensities[J]. Soil and Tillage Research, 2016, 156: 54-62.
[38] Mohammad Hossein Mohammadi, Farrokh Asadzadeh, Marnik Vanclooster. Refining and unifying the upper limits of the least limiting water range using soil and plant properties[J]. Plant Soil, 2010, 334: 221-234.
[39] Siegelissem C M, James A Burger, Robert F Powers, et al.
Seedling root growth as a function of soil density and water content[J]. Soil Science Society of America Journal, 2005, 69: 215-226.
[40] Liu Xiaona, Lu Sen, Horton Robert, et al. In-situ monitoring of soil bulk density with a thermo-TDR sensor[J]. Soil Science Society of America Journal, 2014, 78(2): 400-407.
![]()
![]()
![]()
Evaluating the stability of black soil water content in Northeast China under no tillage and ridge tillage using least limiting water range
Liu Shuzhen, Gao Weida※, Ren Tusheng
(College of Land Science and Technology, China Agricultural University, Beijing 100193, China)
Abstract: An optimal range of water content in soil plays an important role in the whole season of crop growth, in order to obtain stable yields in rainfed agricultural region. This study aims to investigate the temporal stability of soil water content in black soil under the no tillage (NT) and ridge tillage (CT) modes subjected to different rainfall conditions in Northeast China. The long-term tillage experiment was conducted in 2011 at Jilin Lishu Experimental Station of China Agricultural University. The time domain reflectometer (TDR) probes were installed in the soil depth of 5, 10 20 and 40 cm under NT and CT treatments to monitor the volume dynamics of soil water content. Least Limiting Water Range (LLWR) that calculated from the curves of soil water retention and penetration resistance was used as an indicator to evaluate the temporal variability and the availability of soil water content under three rainfall-type years, including normal year (2014), dry year (2015), and wet year (2016). Moreover, the available water storage of 0-40 cm soil layer was also calculated in two tillage treatments. The normal rate of soil water content was defined as the ratio of the cumulative number of days to the total number of days in each period of corn growth stages, where the soil water content was within LLWR. The mean of geometric means (MGMs) for four stages of corn growth can be calculated to evaluate the normal rate of soil water content during the whole crop growth season. The results indicated that: 1) The values of LLWR ranged from 0.05 to 0.19 cm3/cm3 in both tillage treatment. In the 5-10 cm soil layer, the LLWR in NT treatment was significantly smaller than that in CT treatment. There was no significant difference observed in the soil layers of 0-5, 10-20 and 20-40 cm in two tillage treatment. 2) Lower normal rate of soil water content occurred mainly in the 10-40 cm soil layer under both tillage treatments. During the whole growth season, the MGMs of 0-40 cm profile under NT treatment were 48%, 72% and 85% in normal, dry and wet year, respectively, with the coefficient of variance (CV) of 0.23. In CT treatment, the MGMs were 56%, 20% and 51% in normal, dry, and wet year, respectively, with the CV of 0.38. 3) Higher mean available water storage can be obtained in the soil layer of 0-40 cm after NT treatment than that of CT. In the 0-40 cm layer, the difference in available soil water storage between NT and CT was minimum in 2016 (wet year), where that of NT was 8.95 mm higher than that of CT. The maximum difference occurred in 2015 (dry year), where that of NT was 13.99 mm higher than that of CT. The soil water content under NT treatment was more stable within the LLWR than that under CT treatment, especially in the extreme weather conditions, such as dry and wet year. It infers that there is a relatively low risk of water limitation condition for the crops under NT treatment in the black soil in Northeast China, when climate change in future. This finding can provide a field management strategy to obtain a stable crop production in Northeast China.
Keywords: soils; tillage; water content; no-tillage; rainfall type; least limiting water range