
评估堆叠和混合合奏学习方法,以估计日常参考蒸发

![]()

 Agricultural Water Management 253 (2021) 106912
![]()
Reference evapotranspiration change in Heilongjiang Province, China from ![]() 1951 to 2018: The role of climate change and rice area expansion
1951 to 2018: The role of climate change and rice area expansion
Xuhua Hu a, b, Mengting Chen a, Dong Liu b, Dan Li a, Li Jin c, Shaohui Liu c, Yuanlai Cui a,
Bin Dong a, Shahbaz Khan d, Yufeng Luo a,*
a State Key Laboratory of Water Resources and Hydropower Engineering Science, Wuhan University, Wuhan, Hubei 430072, China
b School of Water Conservancy & Civil Engineering, Northeast Agricultural University, Harbin, Heilongjiang 150030, China
c Jinxi Irrigation District Construction Administration Station of Fujin City, Fujin, Heilongjiang 156100, China
d Regional Science Bureau for Asia and the Pacific UNESCO, DKI Jakarta 12110, Indonesia
![]()
A R T I C L E I N F O
![]() Handling Editor - Dr. B.E. Clothier
Handling Editor - Dr. B.E. Clothier
![]() Keywords:
Keywords:
Reference evapotranspiration Spatio-temporal change Climate change
Rice area expansion
A B S T R A C T
![]()
It is of great significance to study the variation in reference evapotranspiration (ETo) and the factors that in- fluence it to ensure the sustainable and efficient utilization of water resources. In this study, the spatio-temporal changes in ETo and rice areas as well as the relationship between them in Heilongjiang Province, China, from 1951 to 2018 were analysed by using trend, correlation and contribution analyses. The results showed that rice area expansion is an important factor affecting ETo changes. ETo in Heilongjiang Province decreased during the study period. The areas with high ETo in the Songnen and Sanjiang Plain showed a gradually shrinking trend. Climate change and rice area expansion both contributed to the decline in ETo. The decreases in sunshine duration and average wind speed in Heilongjiang Province were the main reasons for the decrease in ETo. Rice
area in Heilongjiang province continued to increase at a rate of 0.54 × 10⁵ ha yr—1. The expansion of rice area in
Sanjiang Plain was the largest, followed by Songnen Plain. In response to the rice area expansion, the rise in average temperature slowed down, the average relative humidity was increased, while wind speed was reduced, which directly lead to the decrease in ETo. The effects of the transformation of different land types into rice fields on ETo were different. The cumulative effects of wetlands and dry fields conversion to rice fields on ETo were
7.67 mm yr—1 and — 20.15 mm yr—1 in Sanjiang Plain respectively.
![]()
Evapotranspiration is an important process in the water and energy cycles, and it is also one of the key factors affecting crop growth, dry biomass production and yield (Qiu et al., 2019). A detailed under- standing of the changes in reference evapotranspiration (ETo) and the factors that influence it is essential for the scientific management of water resources and sustainable protection of agricultural production (Nam et al., 2015; Lv et al., 2018). Climate and land use changes have a strong impact on ETo (Chen et al., 2011, 2019; Dias et al., 2015; Li et al., 2017; Odongo et al., 2019). However, the impact of land use changes caused by agricultural practices, such as irrigation, on local hydrological conditions is still unclear (Ozdogan and Salvucci, 2004). Furthermore, scientific irrigation management is key to ensuring stable high yields and high water use efficiency of food crops (Tang et al.,2018). Analysing changes in ETo with the synergy of climate and irrigation is very
important for planning regional irrigation, adjusting agricultural planting structures, and protecting the ecological environment (Han et al., 2010; Jia et al., 2016).
In the context of climate change, changes in all meteorological var- iables, such as temperature, wind speed, rainfall, and solar radiation, have led to changes in ETo (Scheff and Frierson, 2014; Nam et al., 2016; Luo et al., 2018). For example, a decrease in sunshine duration and wind speed have led to a decrease in evapotranspiration, but the opposite is true for an increase in temperature (Roderick and Farquhar, 2002; Gao et al., 2006; Xie et al., 2008; Nan et al., 2012; Pour et al., 2020), and ETo has also been significantly affected by relative humidity (Li et al., 2015; Kong et al., 2018). Chen and Huo (2016) used a method of removing meteorological factors to assess the impact of climate change on ETo. Temperature and wind speed were believed to be the main factors that influence ETo in the Heihe River Basin (Jia et al.,2016). Yassen et al. (2020) observed that ETo in Egypt was greatly affected by climate
![]()
E-mail address: yfluo@whu.edu.cn (Y. Luo).
https://doi.org/10.1016/j.agwat.2021.106912
Received 18 December 2020; Received in revised form 5 April 2021; Accepted 7 April 2021
Available online 29 April 2021
0378-3774/© 2021 Elsevier B.V. All rights reserved.
![]()
![]()
change in most regions, with more profound impact in summer than winter. The relationship between climate conditions and terrestrial surface processes in different geographic regions varies (Koster, 2004). Although similar studies have been conducted in Northeast China, cli- matic impacts on ETo in cold rice-growing areas, especially in rice-concentrated areas in Heilongjiang Province, are still unclear.
Irrigation is considered an important anthropogenic process affecting the climate and hydrology (Lobell et al., 2009). In agricultural areas, diversion and irrigation changes affect the regional microclimate. For example, the expansion of irrigation areas has led to, among other changes, a decrease in local temperature (Bonfils and Lobell, 2007; Han and Yang, 2013; Han et al., 2018), a decrease in wind speed (Alpert and Mandel, 1986; Jia et al., 2016), an increase in humidity (Zhao et al., 2016), and an increase in precipitation (Jo´dar et al., 2010; Mao et al., 2011), which affects potential evapotranspiration (Ozdogan and Sal- vucci, 2004). Therefore, crop and net irrigation water requirements will be significantly affected by these changes. Understanding how reference evapotranspiration changes with irrigation may have important impli- cations for future agricultural water management. Han et al. (2014) found that ETo decreased with irrigation expansion. In general, there are few studies on the impacts of irrigation and other agricultural activities on evapotranspiration, especially for the large-scale expansion of rice areas. It is necessary to systematically explore the impact of increased rice areas on ETo.
Rice is one of the three major food crops in China, and its production has been increasing continuously (China National Bureau of Statistics, 2019). With agricultural development and the powerful support of the government, rice areas in Heilongjiang Province expanded rapidly, ac- counting for 13.05% of the total rice area of China (Liu et al., 2013; Gao et al., 2020). The expansion of rice areas will inevitably cause a sub- stantial increase in irrigation water use, which will affect ETo. It is very important to explore the impact of climate change under natural con- ditions and the rice area expansion caused by human activities on regional ETo changes. The objectives of this work are therefore (1) to analyse the temporal and spatial changes in ETo and rice areas in Hei- longjiang Province; (2) to analyse the effects of meteorological variables change on ETo in Heilongjiang Province; and (3) to explore the impact of increased rice areas on ETo under the background of climate change in Heilongjiang Province.
2.1. Study area and data
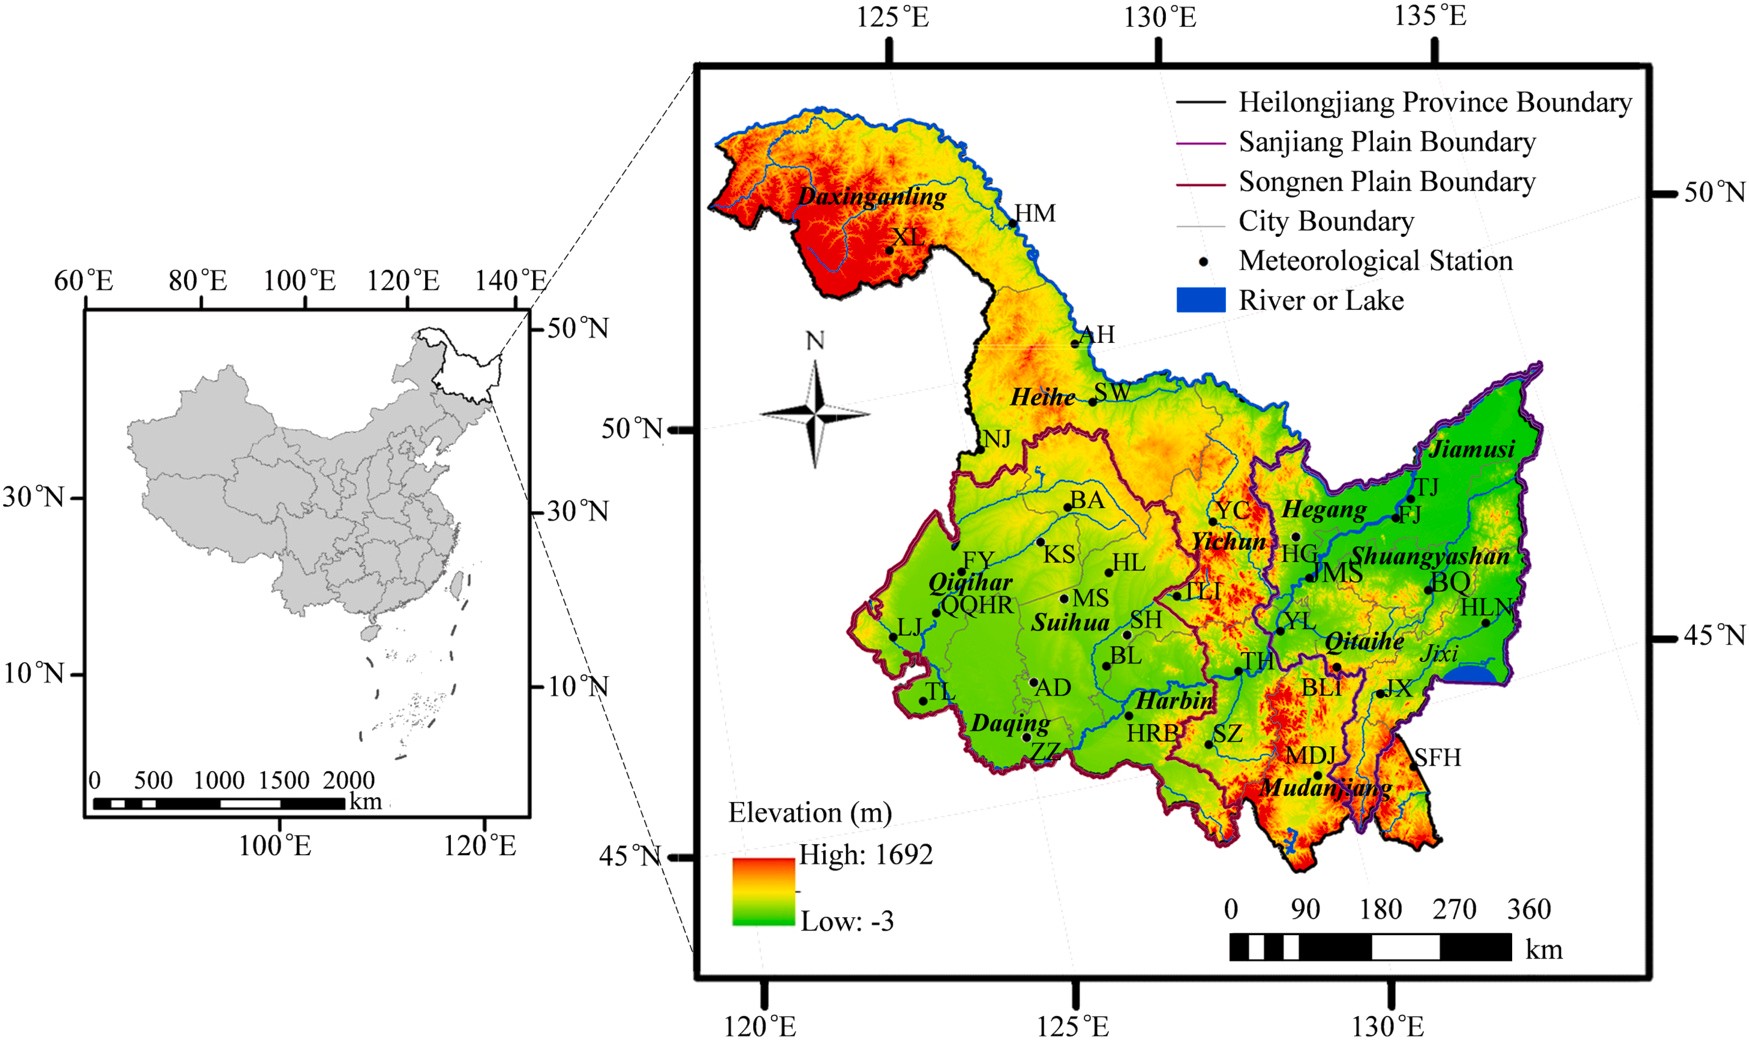
![]() The study area, Heilongjiang Province, is located in the northern- most part of Northeast China, between 43◦26′ N~53◦33′ N and 121◦11′ E~135◦05′ E (Fig. 1). Its total area is approximately 4.73 105 km2 which includes 12 prefecture-level cities and the Daxinganling.
The study area, Heilongjiang Province, is located in the northern- most part of Northeast China, between 43◦26′ N~53◦33′ N and 121◦11′ E~135◦05′ E (Fig. 1). Its total area is approximately 4.73 105 km2 which includes 12 prefecture-level cities and the Daxinganling.
![]() Heilongjiang Province has higher elevations in the northwest and southeast and lower plains in the northeast and southwest. It is in the cold temperate zone and has a temperate continental monsoon climate. It is the province with the lowest temperature in China, and the tem- perature difference between the northern and southern areas is large (Gao and Liu, 2011). Summers are short and rainy here, and winters are cold and long. Average temperature in Heilongjiang is approximately 1–5 ◦C, and annual precipitation is 400–600 mm. Precipitation from
Heilongjiang Province has higher elevations in the northwest and southeast and lower plains in the northeast and southwest. It is in the cold temperate zone and has a temperate continental monsoon climate. It is the province with the lowest temperature in China, and the tem- perature difference between the northern and southern areas is large (Gao and Liu, 2011). Summers are short and rainy here, and winters are cold and long. Average temperature in Heilongjiang is approximately 1–5 ◦C, and annual precipitation is 400–600 mm. Precipitation from
June to September accounts for more than 65% of the annual precipi- tation. With the development of agriculture, Heilongjiang Province has become an important commercial grain production base in China (Su et al., 2021). The western Songnen Plain and the eastern Sanjiang Plain are the two main grain production areas in Heilongjiang Province, both of which mainly produce rice (Lu et al., 2017).
The statistical data of rice areas from 1951 to 2018 were obtained from the Heilongjiang Statistical Yearbook (Heilongjiang Bureau of Statistics, 1987) and the Statistical Yearbook of Heilongjiang State Farms (Bureau of Statistics of Heilongjiang State Bureau of Agriculture Reclamation, 1993). These yearbooks are annual statistical publications reflecting economic and social development and are published by the China Statistics Press. The meteorological data used in this study, including the daily maximum temperature, daily minimum tempera- ture, average temperature, average relative humidity, sunshine dura- tions, average wind speed and daily precipitation at 33 National Meteorological Observatory (NMO) stations from 1951 to 2018, were provided by the China Meteorological Data Network. A total of 5.72 million data were collected, with an error rate of almost 0 and a missing rate of 0.06%. The datasets are available and have been quality controlled by the National Climate Information Center with a data loss rate of less than 0.1% (Zhao et al., 2020). The few missing data were interpolated based on the data from adjacent stations (Lin et al., 2018).
![]()

These climate variables were used to calculate ETo in Heilongjiang Province according to the FAO-56 Penman-Monteith method. The location and distribution of meteorological stations within Heilongjiang Province are shown in Fig. 1. Detailed information on these stations, including the station code, name, location, latitude, longitude, and altitude, is presented in Table 1. The land use information in 1980 and 2018 was obtained from the Date Center for Resources and Environ- mental Sciences, Chinese Academy of Sciences (http://www.resdc.cn). These data were generated by visual interpretation from Landsat TM/ETM satellite images with a horizontal resolution of 1000 m. The increase of construction land in Heilongjiang Province from 1960 to 2010 was concentrated in the South (Zhang et al., 2017). In the analysis
of the effects of rice area expansion, the data of Harbin (HRB) and other stations with an increase of construction more than 30 km2 were deleted to eliminate the interference of urbanization and industrialization.
2.2. Methods
2.2.1. Calculation of reference evapotranspiration
The Penman-Monteith method recommended by the Food and Agriculture Organization (FAO) of the United Nations has a complete theoretical basis and a small calculation error. It is the most widely used
surface (m s—1), es is the saturation vapor pressure (kPa), ea is the actual
vapor pressure (kPa) and Δ is the slope of the saturation vapor pressure curve (kPa ◦C—1).
2.2.2. Linear trend analysis and Mann-Kendall test
A linear regression equation was established to analyse the changing trends of ETo and meteorological variables in Heilongjiang Province. Time t was taken as the independent variable and ETo or meteorological variables x as the dependent variable. The regression equation is as follows:
x = at + b (2)
where x is the value of ETo or meteorological variables, a is the slope of the equation, which is used to represent the linear trend of the time series, t is the year, and b is the regression constant. The series has a positive trend when a is greater than 0, and it has a negative trend when a is less than 0. The larger the absolute value of a is, the more significant the positive or negative trend of time series is.
![]() The reliability test of the linear trend results adopts the Mann- Kendall test. This method is suitable for the non-parametric test of time series trends (Yavuz, 2018). The statistic S of time series x is calculated as follows:
The reliability test of the linear trend results adopts the Mann- Kendall test. This method is suitable for the non-parametric test of time series trends (Yavuz, 2018). The statistic S of time series x is calculated as follows:
ETo calculation method. This study uses it to calculate ETo, and the
n—1 n
![]()
![]()
ETo
0.408Δ(Rn — G) + γ u2(es — ea)
![]() = Δ + γ(1 + 0.34u2)
= Δ + γ(1 + 0.34u2)
(1)
where xj is the value of jth data, n is the length of the data series and sgn is the sign function defined as follows:
![]()
where ETo is the daily reference evapotranspiration (mm day—1), Rn is the net radiation at the crop surface (MJ m—2 d—1), G is the soil heat flux (MJ m—2 d—1), γ is the psychometric constant (kPa ◦C—1), T is the mean air temperature (◦C), u2 is the mean wind speed at 2 m above the ground
sgn.xj — xi) =
1 if xj > xi 0 if x x
![]()
 ⎩ —1 if xj < xi ⎭
(4)
![]()
![]()
![]()
![]()
![]()
![]() When n ≥ 8, the statistic S approximately obeys the normal distri-
When n ≥ 8, the statistic S approximately obeys the normal distri-
[1.5h
(h)3 ]
![]()
![]()
E(S) = 0 (5)
![]() n(n — 1)(2n + 5) — ∑ t (i — 1)(2i + 5)
n(n — 1)(2n + 5) — ∑ t (i — 1)(2i + 5)
![]()
where h is the distance between the samples; C0 is the nugget; C1 is the part of sill; C0 +C1 is the sill; a is the variation distance.
Var(S) =
i
i=1
18
(6)
2.2.4. Correlation analysis
Pearson correlation coefficient indicates the degree of correlation
![]() where E S is the mean of the statistic S; Var S is the variance of the statistic S; m is the number of tied groups; ti denotes the number of data points in the ith group. The test statistic ZMK is:
where E S is the mean of the statistic S; Var S is the variance of the statistic S; m is the number of tied groups; ti denotes the number of data points in the ith group. The test statistic ZMK is:
between two sets of data (Sun and Qin, 2016). It was used to analyse the
relationship between ETo and meteorological variables. The following formula adapted from (Revadekar et al., 2012; Kang et al., 2017) was
used for this purpose:
⎧⎪ S — 1 ⎫⎪
N
![]()
⎪⎪⎨ √̅V̅̅̅a̅̅r̅̅(̅̅S̅̅)̅̅
S > 0
![]() ⎪⎬
⎪⎬
∑i=1[(xi —
X) ×
(yi —
Y) ]
(11)
![]()
![]() ZMK =
ZMK =
0 S 0
⎪
(7)
rxy = √̅∑̅N̅̅̅̅(̅̅̅̅̅̅̅̅̅̅̅̅̅̅̅̅)̅̅̅2̅̅̅̅̅̅̅̅∑̅̅N̅̅̅̅̅(̅̅̅̅̅̅̅̅̅̅̅̅̅̅̅̅)̅̅̅2̅
![]()
![]()
![]()
![]() S 1
S 1
⎩ √̅V̅̅̅a̅̅r̅̅(̅̅S̅̅)̅̅
S < 0 ⎪⎪⎭
i=1
xi — X
×
![]() i=1
i=1
yi — Y
![]()
![]()
The null hypothesis (H0) of no trends is accepted if —
Z1—α ≤ ZMK ≤ Z1—α , otherwise H0 is rejected and the existence of a trend
where rxy is the correlation coefficient between x and y, while xi is the
![]() ETo value in i year, y is the meteorological variable value in i year. X and
ETo value in i year, y is the meteorological variable value in i year. X and
![]()
![]()
![]()
![]()
![]()
![]() is accepted. The significance of the trends was tested at the significance
is accepted. The significance of the trends was tested at the significance
level α. In this study, α is set at 0.05 and 0.01 significant level. Besides,
the Sequential version of MK test statistic was employed to identify the
approximate starting point (here year) of change in time series of rice
area.
2.2.3. Spatial data processing
The kriging interpolation method in ArcGIS 10.2 was used to inter-
polate ETo and meteorological variables to a raster surface, and WGS-
1984 coordinates were used as the map coordinate system. Kriging
interpolation based on the semivariogram model performs unbiased
optimal estimation of regional variables in a limited region. It extends
discrete point information to continuous spatial information and obtains
ideal prediction results (Lv et al., 2019; Oliver and Webster, 1990). In
this study, ordinary kriging (OK), which is the most popular type of
kriging, was used to interpolate ETo and meteorological variables at
different timescales (Moghbeli et al., 2020). Suppose there are alto-
gether n measured points in the neighborhood of the estimated point x0,
i.e., x1, x2., xn. The interpolation formula of OK is as follows:
n
Z∗(x0) = λiZ(xi) (8)
i=1
where Z xi are the observations selected in the x0 neighborhood to perform the estimation of Z∗ x0 ; Z∗ x0 is the kriging estimate at loca- tion x0; λi denotes the weight of the ith observation. Under the condition of unbiased and minimum variance, the equation system of the weight coefficient λi is:
are positively related when r > 0. X and Y have a negative correlation
when r < 0. The greater the absolute value of the number, the greater
the strength of the correlation between the two variables. SPSS software
was used for statistical analysis. The significance of correlation coeffi-
cient was tested by t-test (Zhang et al., 2011). The statistical significance
in this study corresponded to a significance level of p < 0.05(*) and
p < 0.01(**).
2.2.5. Contribution assessment
Han and Hu (2012) and Jia et al. (2016) considered that climate
change and irrigation were important causes of regional evapotranspi-
ration change. Rice area expansion in Heilongjiang Province mainly
occurred in the Sanjiang and Songnen Plain (Lu et al., 2017). That is, the
irrigation water consumption of the Sanjiang and Songnen Plain
increased significantly. Rice area expansion was the main land use
change type in these two plains during the period of 1980–2015 (Chen
et al., 2018). Thus, it has been assumed that the changes in ETo in the
Sanjiang and Songnen Plain were only affected by climate change and
rice area expansion.
First order differential method was used to remove the trends of
meteorological variables to effectively separate the trend component
and the non-trend component. Trend components include the trend
caused by climate change and the trend caused by rice area expansion.
The first order difference is the difference between two consecutively
adjacent items in the sequence. After the original sequence Xt is first
order differentiated, a new sequence Yt without trend can be obtained
![]()
![]()
![]()
⎧⎪ ∑n
λ C.x x ) μ
C.x
x ) j
1 2 … n
Yt = Xt+1 — Xt (12)
![]()
![]()
![]()
⎨ i=1 i
i, j + =
0 , j ( = , , , )
(9)
T X Y
(13)
![]()
![]()
![]()
⎩⎪ ∑n
λi = 1
t = t — t
![]()
![]()
![]()
i=1
where C(xi, xj) is the covariance function of A and B. The most
commonly used semivariogram models are the spherical, exponential,
and Gaussian models (Dalezios et al., 2002; Moghbeli et al., 2020).
Spherical model is the most commonly used and has good accuracy. In
this study, the Kriging interpolation method with spherical model as
semivariograms is used for spatial interpolation analysis. The spherical
model is expressed as follows:
where Xt is the original sequence, Yt is the detrended sequence, Tt is the
![]()
![]() trend component, t is the sample number, and t 1, 2, …, n, where n is
trend component, t is the sample number, and t 1, 2, …, n, where n is
the sequence length.
To quantify the contribution of climate change and rice area
expansion to ETo, the following steps were carried out on the Sanjiang
and Songnen Plain: First, we assumed that if rice area in a region was
unchanged during the period, then any change in ETo in that region was
caused by climate change. It means ∆ETo ∆EToclimate and ∆ETorice 0.
Second, we assumed that in case of change in the rice area, the changes
![]()
![]()
![]()
![]()
![]()
![]()
![]()
![]()
750
![]() 700
700
650
600
550
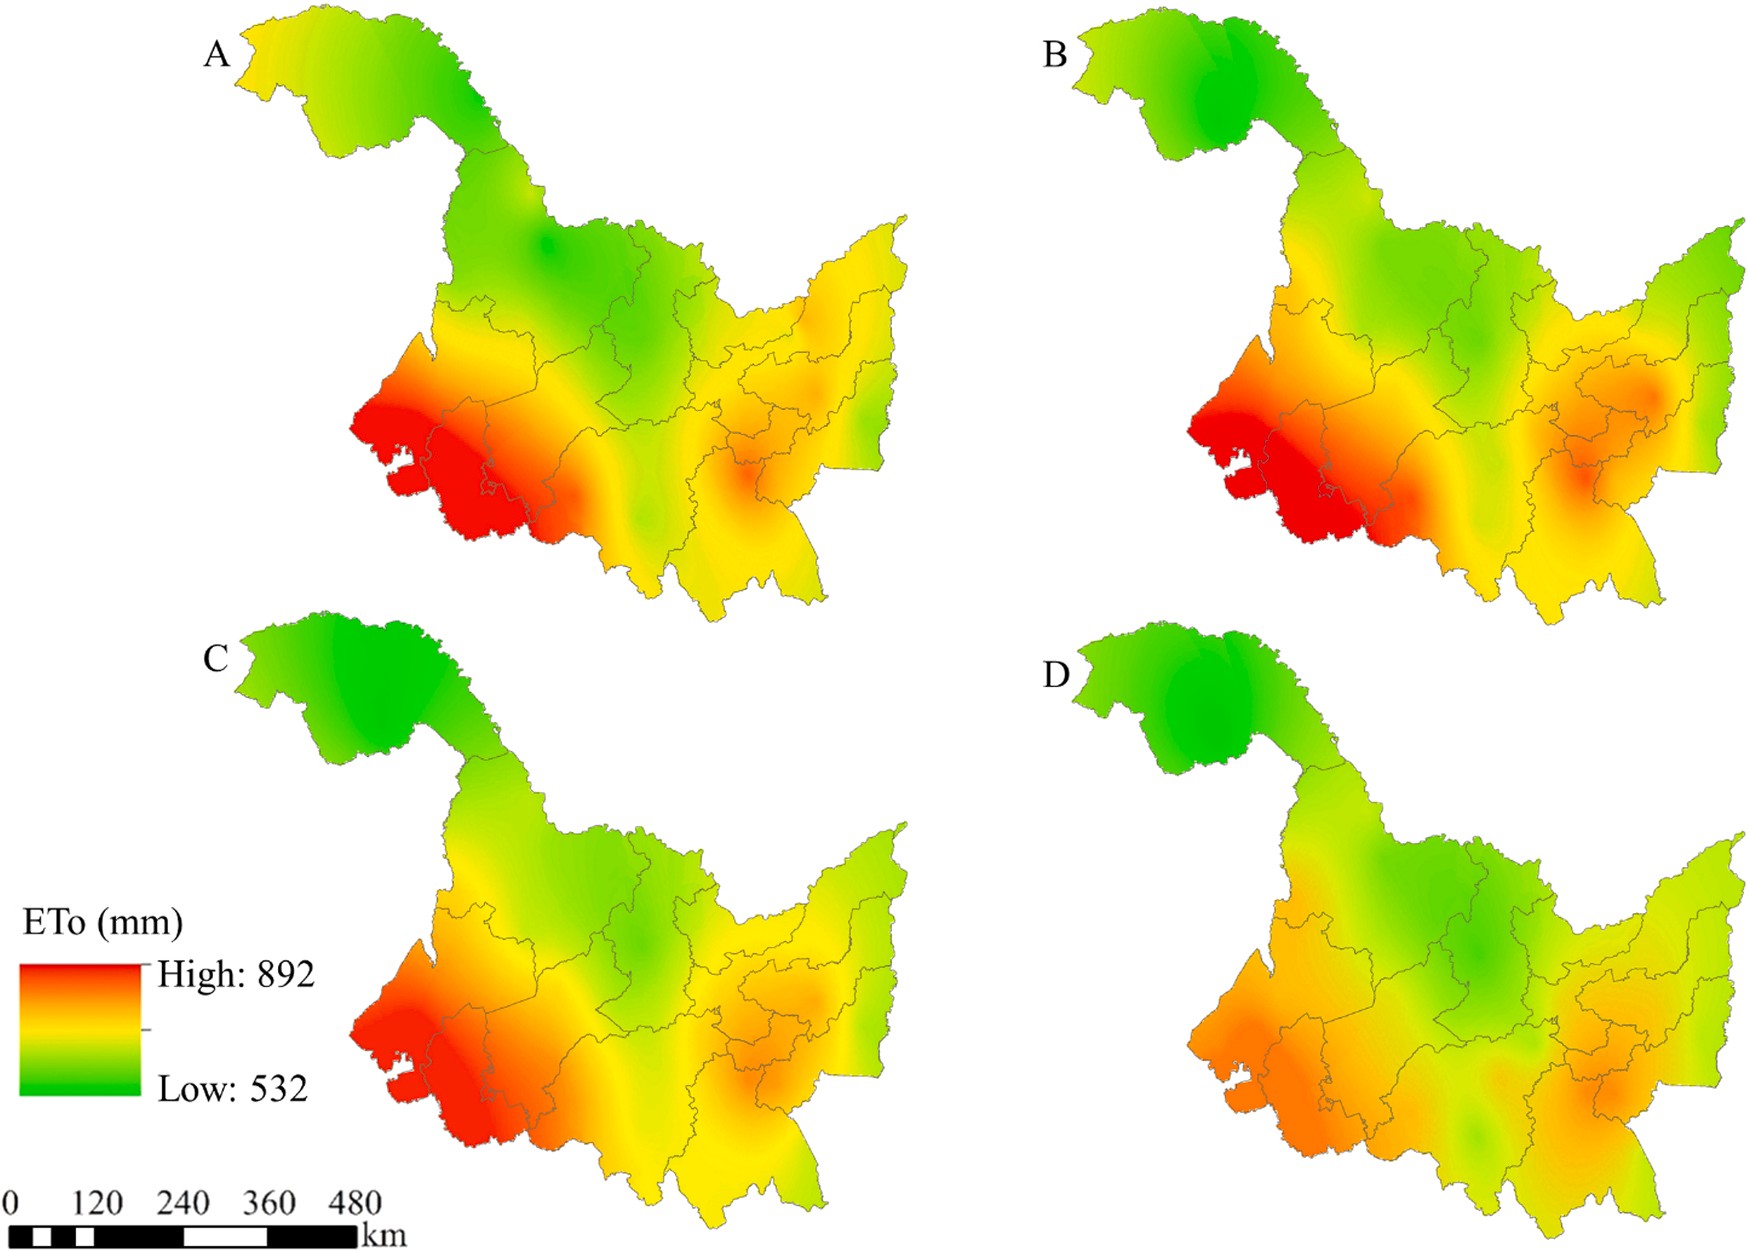
Fig. 2. Average ETo during (A) 1951–1967, (B) 1968–1984, (C) 1985–2001 and (D) 2002–2018.
 EToclimate and ∆ETorice are ETo changes due to climate change and rice area expansion, respectively.
3.1. Spatio-temporal changes in ETo
The spatial distribution of ETo in each period is shown in Fig. 2. It is different in each period. The areas with high ETo were mainly in the Songnen and Sanjiang Plain. In 1951–1967 and 1968–1984, ETo was higher in most areas of the Songnen Plain and the central part of the Sanjiang Plain (Fig. 2A and B). The areas with high ETo in 1985–2001 and 2002–2018 were located in the southwestern Songnen Plain and the southern Sanjiang Plain (Fig. 2C and D).
The comparison between Fig. 2A and B indicated an expansion in the
1951 1961 1971 1981 1991 2001 2011
Year
![]() Interannual variation in ETo in each city in Heilongjiang Province.
Interannual variation in ETo in each city in Heilongjiang Province.
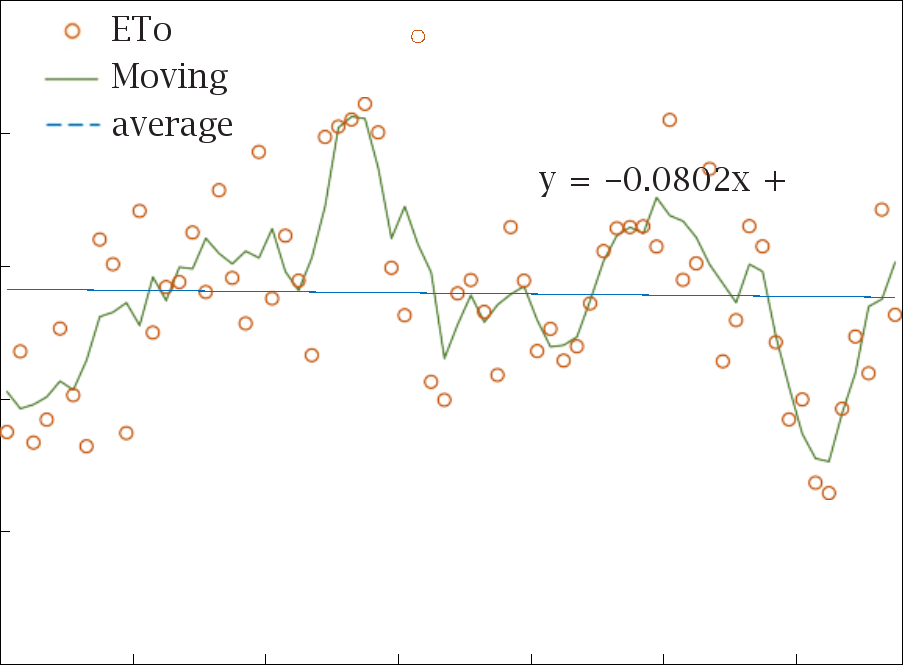
![]() Fig. 3. Trend in ETo in Heilongjiang Province during the 1951–2018 period.
Fig. 3. Trend in ETo in Heilongjiang Province during the 1951–2018 period.
City name Max (mm yr—1)
Min (mm yr—1)
Mean (mm yr—1)
Slope (mm yr—1)
![]()
![]()
in ETo were attributable to the combined effect of climate change and rice area expansion. Therefore, the effects of rice area expansion on ETo in a region can be quantitatively identified by removing the effects of climate change on ETo in that region (refer to Eq. (15)) since the effects of climate change on ETo in a region are the same. The trend of each meteorological variable was removed by first order differential method and ETos was recalculated by using the detrended data series:
∆ETo = ETo — ETos (14)
∆ETo = ∆EToclimate + ∆ETorice (15)
where ∆ETo is the change in ETo; ETos is stationary ETo sequence; ∆
Daxinganling 699.83 534.04 587.19 0.43
Heihe 696.62 492.53 621.42 0.42
Qiqihar 890.39 611.73 776.95 -0.49a
Daqing 994.85 758.02 863.13 -1.27b
Suihua 800.51 563.47 679.05 -0.18
Yichun 674.75 547.66 610.55 -0.29
Harbin 830.34 576.99 696.04 -0.84b
Hegang 767.47 568.81 669.65 -0.13
Jiamusi 772.36 595.25 677.89 -0.16
Shuangyashan 909.88 625.80 732.53 -0.85a
Qitaihe 890.68 668.74 765.19 -0.80a
Jixi 772.60 600.57 680.62 0.14
Mudanjiang 825.84 606.59 688.66 -0.33
![]()
b Significance at 0.01.
![]()
![]() City name Average temperature (℃ yr—1)
City name Average temperature (℃ yr—1)
Average relative humidity (% yr—1)
Sunshine duration (h d—1 yr—1)
Average wind speed (m s—1 yr—1)
Precipitation (mm yr—1)
ETo (mm yr—1)
Daxinganling 0.040b -0.073b -0.008b -0.015b -0.762 0.427b Heihe 0.048b -0.091b -0.006 -0.020b -0.258 0.415
Qiqihar 0.034b -0.068b -0.008 -0.025b 0.537 -0.487a Daqing 0.022b -0.031a -0.012 -0.025b 0.447 -1.274b Suihua 0.028b -0.015 -0.010a -0.012b 0.305 -0.176
Yichun 0.030b -0.036a -0.004 -0.016b 0.289 -0.291 Harbin 0.034b -0.038a -0.018a -0.023b -0.986 -0.835b Hegang 0.020b 0.010 -0.003 -0.003 -0.569 -0.131
Jiamusi 0.024b -0.015 -0.006 -0.008b -0.318 -0.159
Shuangyashan 0.032b -0.024 -0.005 -0.026b -0.963 -0.848a
![]()
Qitaihe 0.029b 0.010 -0.015b -0.008b -0.507 -0.796 Jixi 0.027b -0.017 -0.007a -0.010b 0.228 0.138a Mudanjiang 0.031b -0.040a -0.019b -0.012b 0.821 -0.332 Mean 0.031b -0.033a -0.009 -0.016 -0.134 -0.335
b Significance at 0.01.
![]()
Correlation coefficients between ETo and meteorological variables for cities.
City name Average temperature Average relative humidity Sunshine duration Average wind speed Precipitation
![]()
Daxinganling 0.290a -0.560b 0.319a -0.093 -0.456b Heihe 0.479b -0.555b 0.493b -0.146 -0.452b Qiqihar 0.134 -0.589b 0.379b 0.347b -0.669b Daqing 0.108 -0.535b 0.640b 0.549b -0.683b Suihua 0.286a -0.618b 0.620b 0.355b -0.506b Yichun 0.188 -0.533b 0.699b 0.254a -0.422b Harbin 0.054 -0.556b 0.730b 0.436b -0.419b Hegang 0.354b -0.675b 0.600b 0.348b -0.522b Jiamusi 0.250a -0.720b 0.638b 0.419b -0.581b
Shuangyashan 0.209 -0.711b 0.802b 0.450b -0.569b Qitaihe 0.228 -0.806b 0.679b 0.419b -0.538b Jixi 0.381b -0.687b 0.504b 0.189 -0.517b
![]()
Mudanjiang 0.191 -0.611b 0.518b 0.373b -0.539b
b Significance at 0.01.
![]()
![]()
areas with high ETo in the Songnen and Sanjiang Plain. From the second period to the third period, the high ETo area decreased, with more obvious decreasing trend in the Sanjiang Plain (Fig. 2B and C). From the third period to the fourth period, the high ETo area decreased more obviously, and the area with higher ETo in the Sanjiang Plain was only the southernmost area (Fig. 2C and D). The ETo of Heilongjiang Prov- ince from 1951 to 2018 had an overall decreasing trend. At the same time, the high ETo areas gradually decreased.
![]() In the entire study period, the average ETo in Heilongjiang Province had a decreasing trend (Fig. 3). The linear trend was 0.08 mm yr—1,
In the entire study period, the average ETo in Heilongjiang Province had a decreasing trend (Fig. 3). The linear trend was 0.08 mm yr—1,
and the Mann-Kendall test was not significant. The decreasing trend has been confirmed in other studies (Xie et al., 2017; Nie et al., 2019). The
maximum value appeared in 1982 at 786.53 mm yr—1, and the mini-
mum value appeared in 2013 at 614.40 mm yr—1. The multi-year average ETo was 689.51 mm yr—1.
The changes in ETo in 13 cities in Heilongjiang Province from 1951 to 2018 were different (Table 2). There were 3 cities with increasing trends. They are Daxinganling, Heihe and Jixi. Ten cities had decreasing
trends. Qiqihar, Shuangyashan and Qitaihe had significant decreasing trends, while trends in Daqing and Harbin were extremely significant.
![]() ETo in Daqing changed at the fastest speed of 1.27 mm yr—1. The rate
ETo in Daqing changed at the fastest speed of 1.27 mm yr—1. The rate
![]() of change in ETo in Hegang was 0.13 mm yr—1, which was the slowest.
of change in ETo in Hegang was 0.13 mm yr—1, which was the slowest.
ETo in Daqing had the highest average value of 863.13 mm yr—1. The average annual ETo in Daxinganling was the lowest.
3.2.
Changes of meteorological variables and their effects on ETo
The trends in meteorological variables and ETo with time in each city
in Heilongjiang Province from 1951 to 2018 are shown in Table 3. The average temperature in Heilongjiang Province increased at a rate of
0.031 ℃ yr—1. Heihe had the most obvious temperature rise in the
province. The average change rate of the average relative humidity in
![]() Heilongjiang Province was 0.033% yr—1. The trends in Hegang and Qitaihe gradually increased, and the trends in the other 11 cities grad-
Heilongjiang Province was 0.033% yr—1. The trends in Hegang and Qitaihe gradually increased, and the trends in the other 11 cities grad-
ually decreased. The trends of sunshine duration in the 13 cities all
![]() declined, with an average rate of 0.009 h d—1 yr—1. The trends of the average wind speed in the 13 cities also declined. The average rate of the
declined, with an average rate of 0.009 h d—1 yr—1. The trends of the average wind speed in the 13 cities also declined. The average rate of the
![]() average wind speed was 0.016 m s—1 yr—1. The trends of precipitation
average wind speed was 0.016 m s—1 yr—1. The trends of precipitation
gradually increased in 6 cities and decreased in 7 cities, with an average
![]() rate of 0.134 mm yr—1. Among the 13 cities in Heilongjiang Province, 10 cities had a decreasing ETo trend, and 3 cities had an increasing
rate of 0.134 mm yr—1. Among the 13 cities in Heilongjiang Province, 10 cities had a decreasing ETo trend, and 3 cities had an increasing
![]() trend, with an average rate of 0.335 mm yr—1. Over the past 68 years,
trend, with an average rate of 0.335 mm yr—1. Over the past 68 years,
the average temperature has increased while the average relative hu- midity, sunshine duration, average wind speed, precipitation and ETo showed a decreasing tend in Heilongjiang Province.
The correlations between ETo and meteorological variables in 13 cities in Heilongjiang Province are shown in Table 4. From 1951–2018, ETo in each city was positively correlated with average temperature. The average relative humidity was negatively correlated with ETo in
![]()
![]()
![]()
40
![]() 30
30
20
10
0
-10
 1951 1961 1971 1981 1991 2001 2011
Year
et al., 2012). In addition, the large increase in average temperature, the decrease in average relative humidity and the decrease in precipitation were the main reasons for the large increase in ETo in Daxinganling and Heihe.
3.3. Changes of rice area and their effects on meteorological variables and ETo
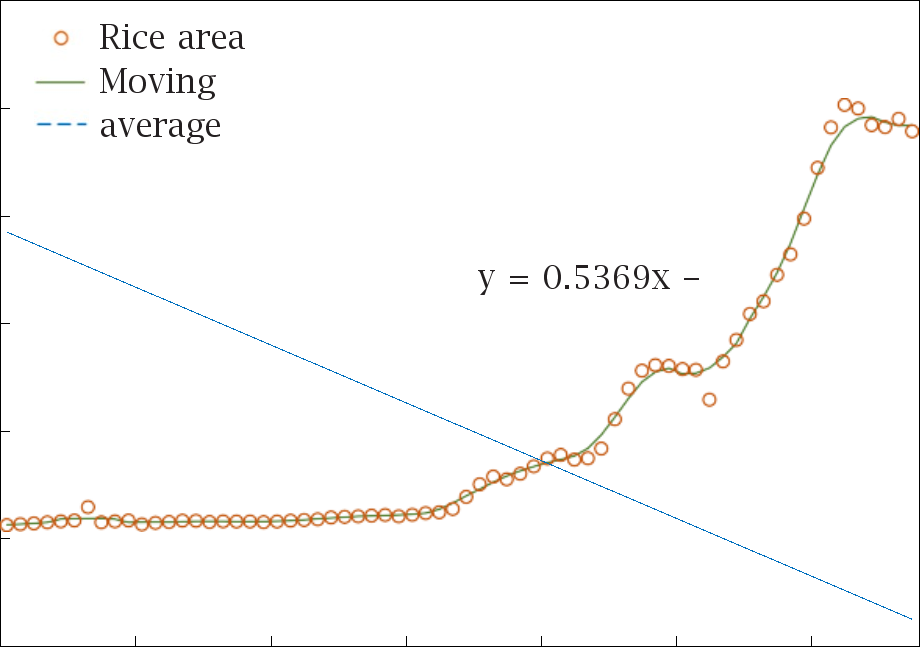
From the time series, rice area in Heilongjiang Province continued to
![]() increase from 1951 to 2018, with a growth rate of 0.54 105 ha yr—1, which passed the Mann-Kendall test with a 0.05 confidence level. More obvious growth in rice area was evident since 1980 (Fig. 4). Since the beginning of 2004, the state has adopted a series of measures to increase grain output and encourage farmers to increase their income (Hou et al., 2015). Rice production in Heilongjiang Province entered a new stage of growth due to the policy of strengthening agriculture and benefiting
increase from 1951 to 2018, with a growth rate of 0.54 105 ha yr—1, which passed the Mann-Kendall test with a 0.05 confidence level. More obvious growth in rice area was evident since 1980 (Fig. 4). Since the beginning of 2004, the state has adopted a series of measures to increase grain output and encourage farmers to increase their income (Hou et al., 2015). Rice production in Heilongjiang Province entered a new stage of growth due to the policy of strengthening agriculture and benefiting
farmers. During 2004–2013, rice area expansion was the fastest, with a
![]()
![]()
![]()
Fig. 4. Trend in rice areas in Heilongjiang Province from 1951 to 2018.
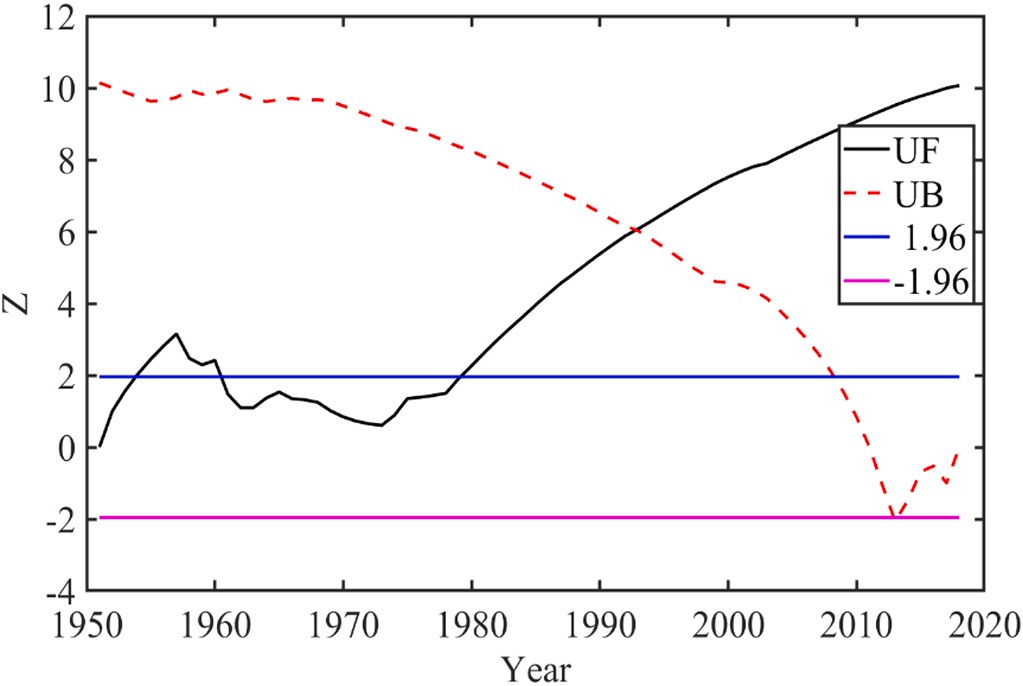
Fig. 5. Mann-Kendall test of rice area in Heilongjiang Province from 1951 to 2018.
each city. Sunshine duration was significantly positively correlated with ETo in each city. The correlation coefficients between the average wind speed and ETo in Daxinganling and Heihe were negative, but the cor- relations were positive in other cities. Precipitation and ETo were significantly negatively correlated in each city. In conclusion, ETo in Heilongjiang Province was positively correlated with average tempera- ture, sunshine duration and average wind speed and negatively corre- lated with average relative humidity and precipitation. ETo had a strong correlation with average relative humidity, sunshine duration and pre- cipitation, and it had a weak correlation with average temperature and average wind speed.
The impact of changes in meteorological variables on ETo was ob- tained through trend analysis and correlation analysis in each city. The increase in average temperature and the decreases in average relative humidity and precipitation in Heilongjiang Province could result in the increase in ETo, and the decreases in sunshine duration and average wind speed could result in the decrease in ETo. ETo in Heilongjiang Province had a decreasing trend, so the effect of sunshine duration and average wind speed on ETo was greater than that of average tempera- ture, average relative humidity and precipitation (Gao et al., 2006; Nan
rate of 2.67 × 10⁵ ha yr—1. In 2013, rice area reached a maximum of
40.29 × 10⁵ ha. Increased rice area during the study period accounted for 8.44% of the province’s total area. The expansion rate of rice area also accelerated gradually. Mann-Kendall test of rice area in Hei- longjiang Province from 1951 to 2018 was shown in Fig. 5. There was a significant upward trend from 1980 to 2018 (UF > 1.96).
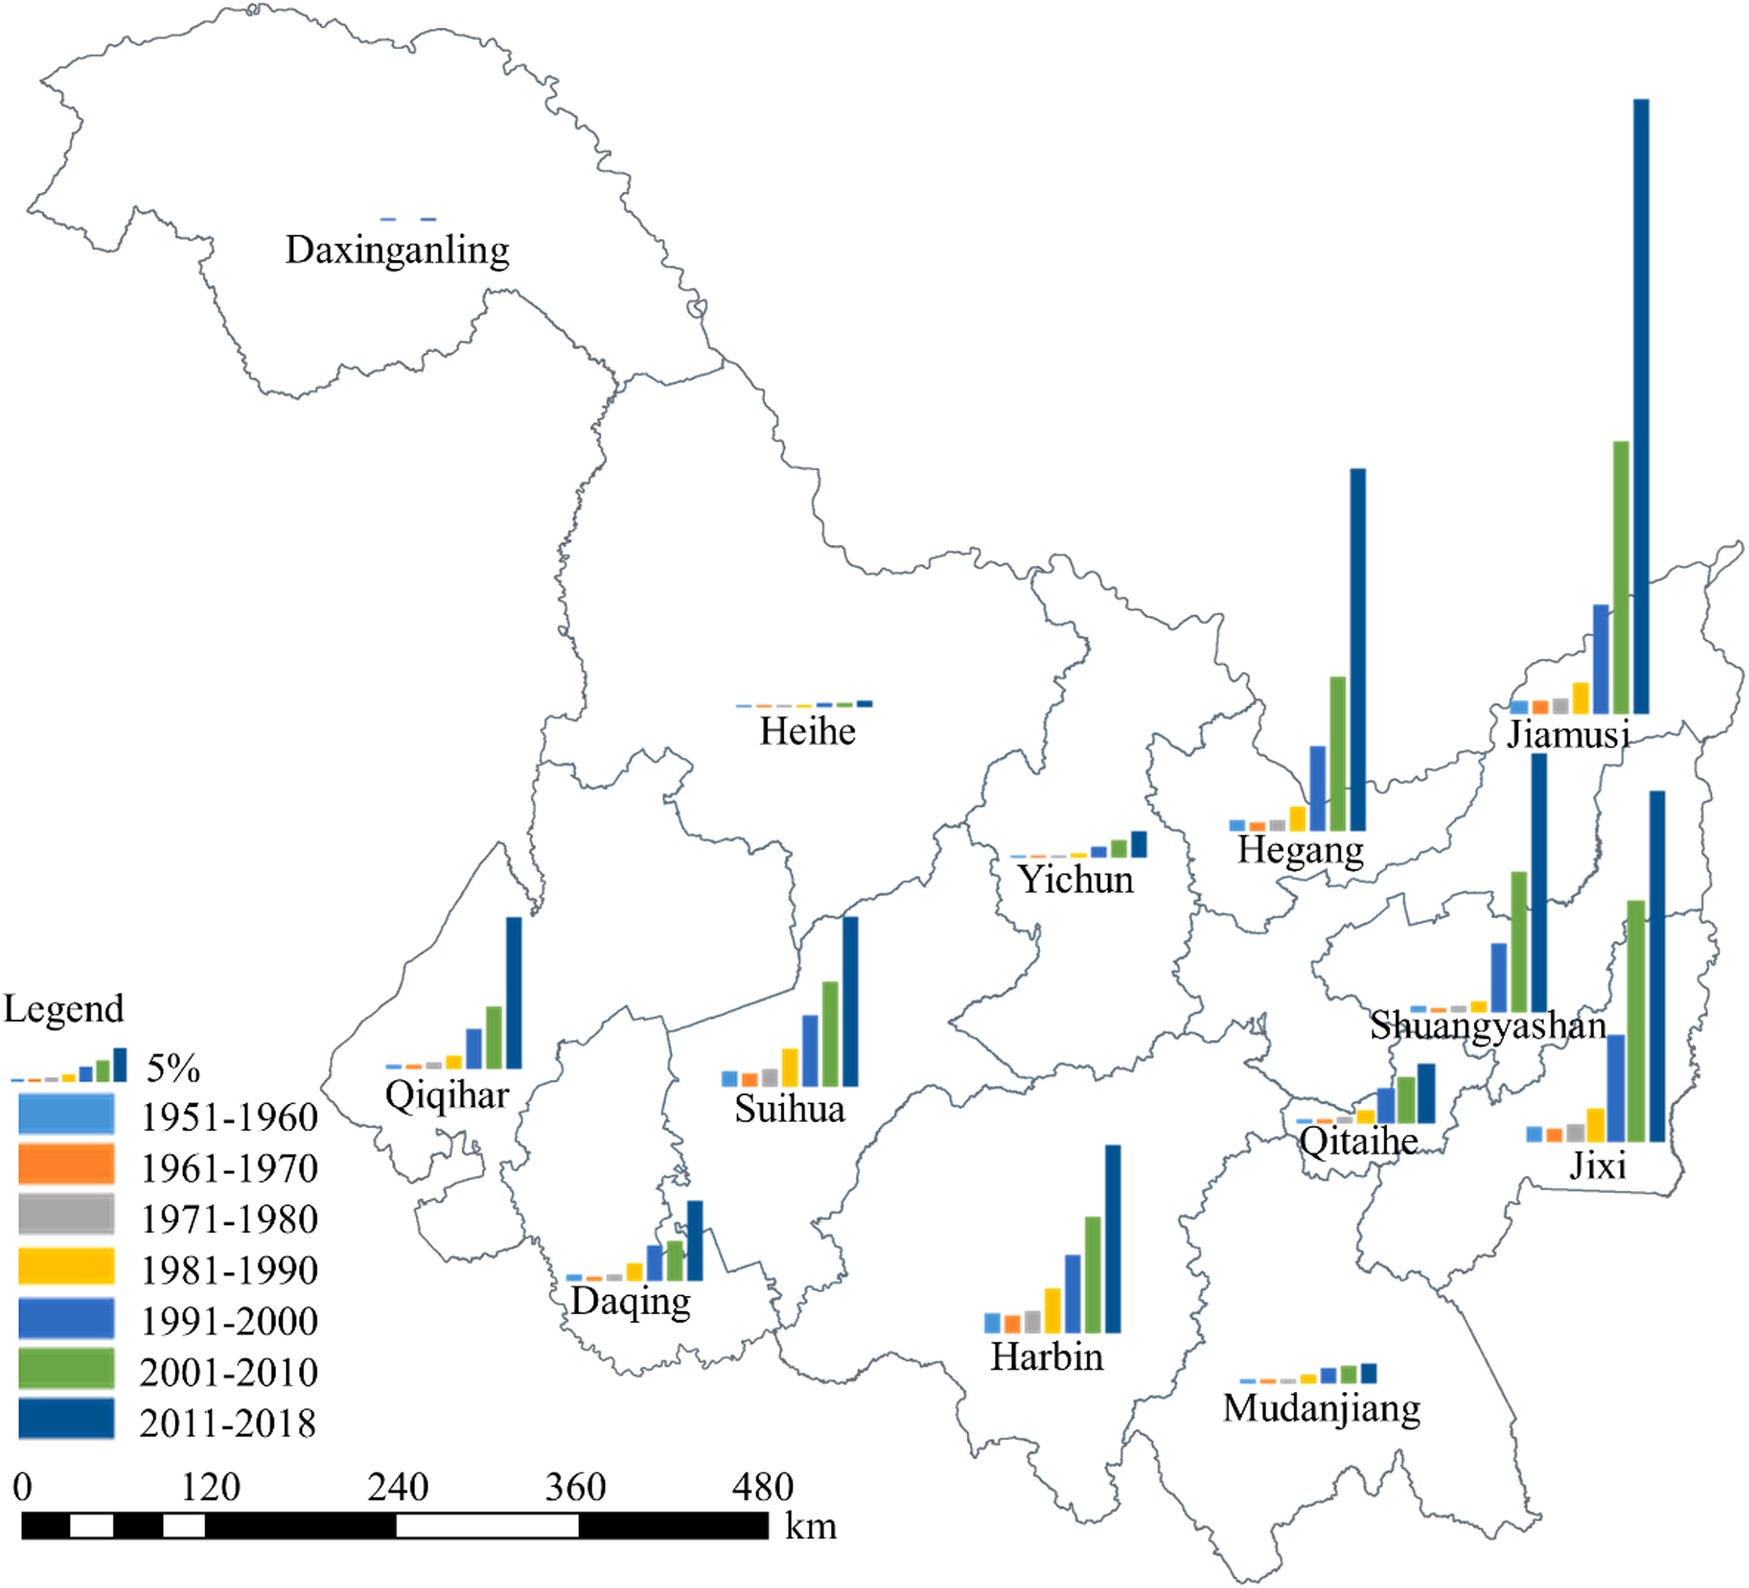
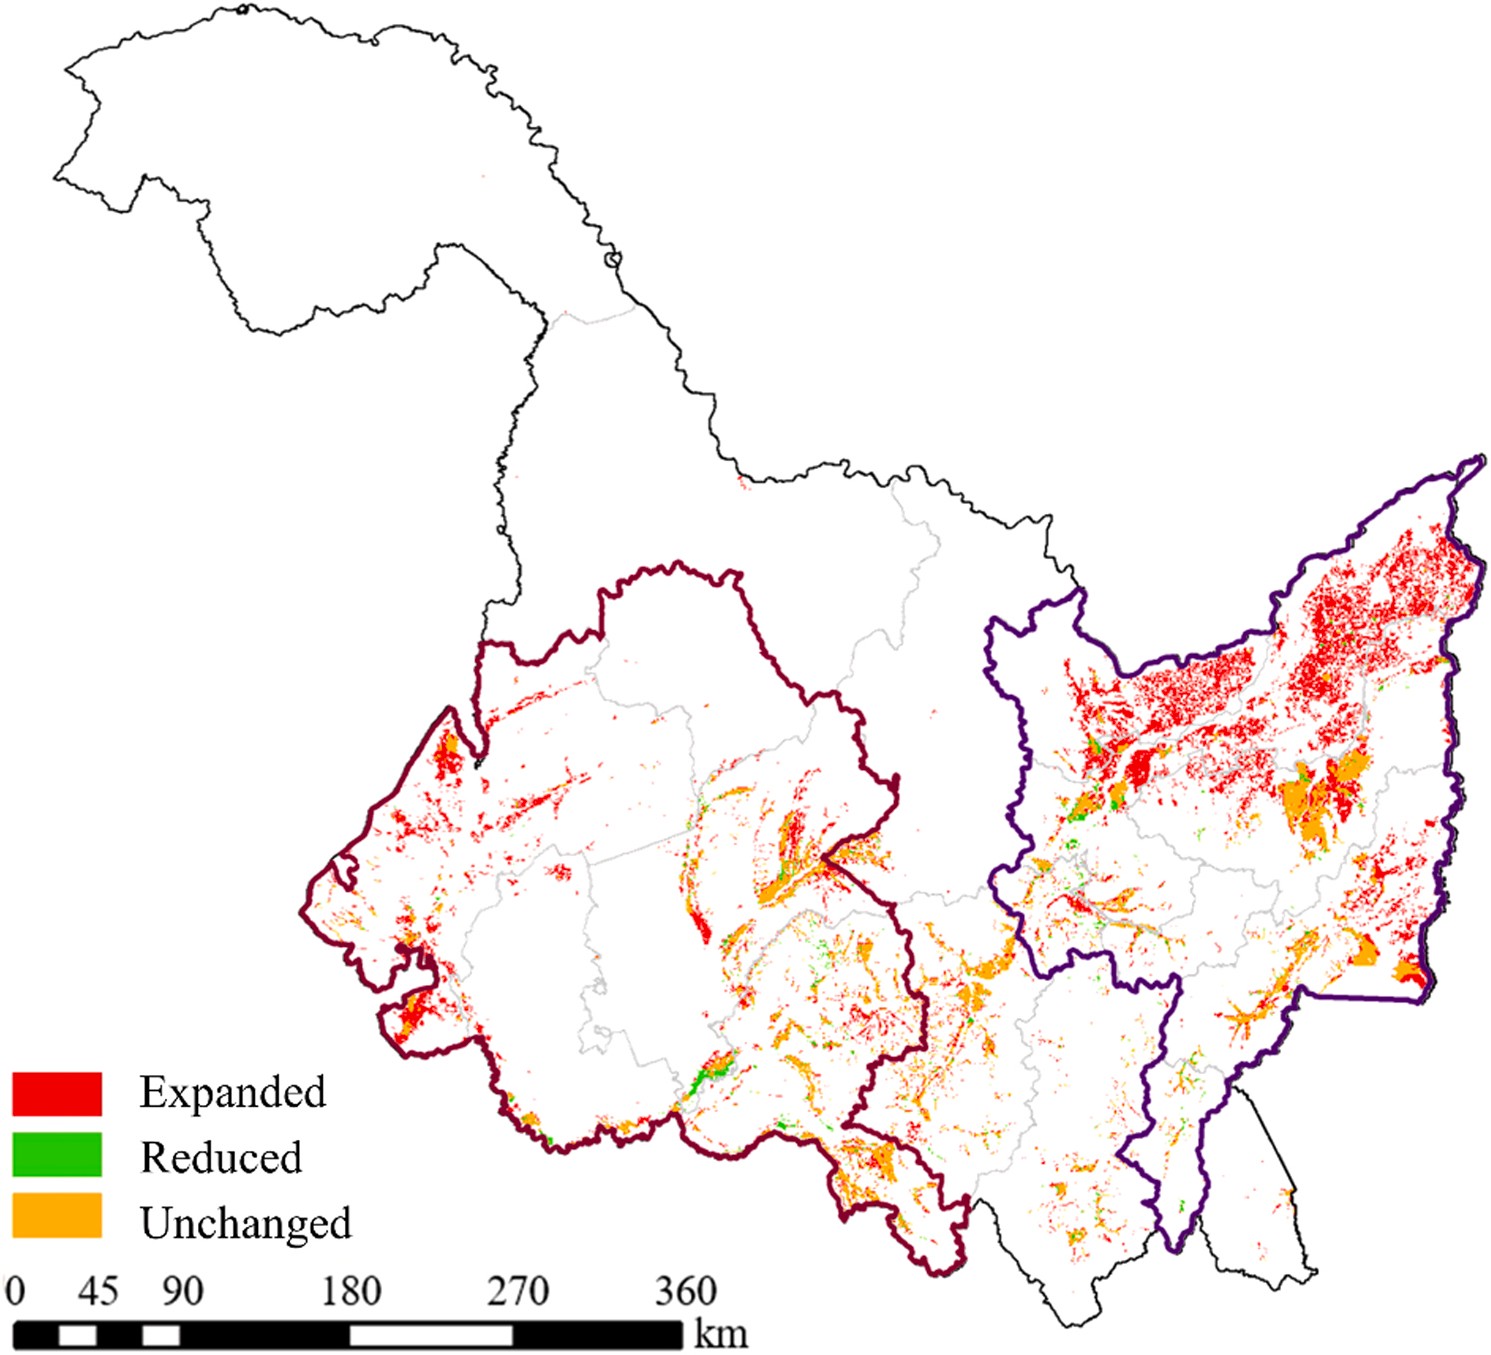
Rice fields in Heilongjiang Province were mainly distributed in the cities located in the Sanjiang Plain and the Songnen Plain (Fig. 6). The expansion of rice area was most obvious in Sanjiang Plain, followed by Songnen Plain. The proportions of rice area in 13 cities in Heilongjiang Province gradually increased, and the increase varied from city to city. The increases in Jiamusi, Shuangyashan, Jixi, Hegang, Harbin, Suihua and Qiqihar were higher than those in the other cities. The growth of Jiamusi in 2011–2018 was particularly prominent because the munic- ipal party committee and municipal government implemented the Jia- musi "10 Million Mu, 10 Billion Kilo" Rice Development Plan in 2010. Daqing, Yichun, Qitaihe and Mudanjiang had a small increase in rice areas. No increase in rice areas was observed in Daxinganling and Heihe. Rice is often grown in plain areas, such as the Songnen and Sanjiang Plain in Heilongjiang Province (Lu et al., 2017). 93.22% of the rice area expansion occurred in Songnen and Sanjiang Plain. Sanjiang Plain accounted for 61.74% and Songnen Plain for 31.48% (Fig. 7). The sig- nificant stage of rice area expansion was selected to study the response of ETo and meteorological variables to rice area expansion. Counties within the same plain have similar topography and climatic conditions.
The difference in trends of meteorological variables in the plains were attributed to the influence of the change in the rice area proportion.
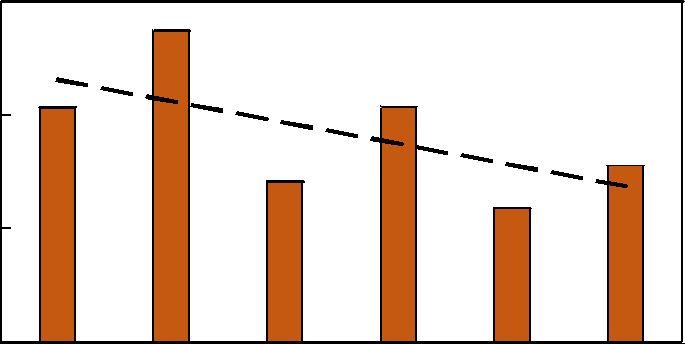
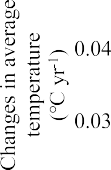
Average temperatures are increasing in all regions, but at different rates. In areas where the proportion of rice area is large, the temperature increase is small (Fig. 8). This result was found in both plains. The average temperature increase in regions where the proportion of rice area changed more than 20% was greater than that in regions with 15–20% rice area change. More swamps were converted into farmland in these regions, which may lead to higher temperatures. An increase in rice area inevitably leads to an increase in irrigation. Soil moisture in- creases with irrigation and then the surface albedo becomes larger. The ground absorbs less solar radiation as the albedo increases. This leads to a drop in the average temperature (Alpert and Mandel, 1986). From the perspective of energy balance, the irrigation of rice fields increases the evapotranspiration of the farmland and changes the energy distribution on the ground. Less energy is used to heat the ground, which will lower the surface temperature (Bonfils and Lobell, 2007; Sacks et al., 2009). These, in turn, affect the local climate. Rice area expansion has restrained the increase in regional average temperature in most areas.
![]()
![]()
![]()
Thus, rice development increases evaporative cooling and lowers the air temperature during the growing season (Bonfils and Lobell, 2007; Han et al., 2018).
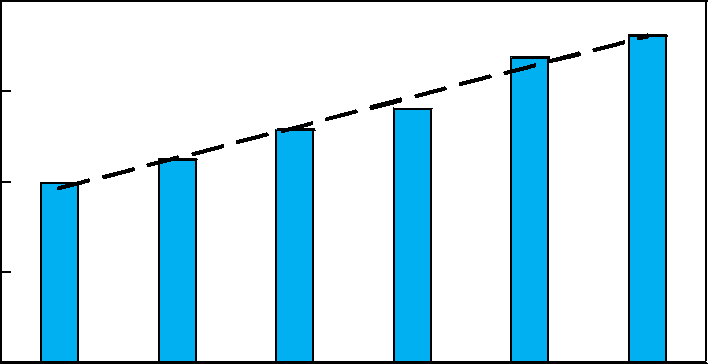
The average relative humidity in the Songnen Plain had an increasing trend in the areas where the proportion of rice areas increased more than 15% (Fig. 9A). The average relative humidity in all counties had an increasing trend in the Sanjiang Plain, and the range increased with rice area expansion (Fig. 9B). In areas where rice expanded faster, the average relative humidity had a faster increasing trend. Irrigation of rice fields increases soil moisture and forms water surface, which in turn increases actual evapotranspiration. This leads to an increase in water vapor in the air. Therefore, the expansion of rice area may promote an increase in average relative humidity. Irrigation expansion in cropland regions exerts significant cooling and wetting effects on the near-surface atmosphere (Puma and Cook, 2010).
The sunshine duration in most counties of the Songnen and Sanjiang Plains showed decreasing trends (Fig. 10). The sunshine duration in the two plains varied with the proportion of rice areas, and the effect of rice expansion on sunshine duration is not clear.
In order to remove the possible impact of increase in buildings sur-
rounding the stations on wind speed, weather stations with an added building area of more than 30 km2 were excluded from data. Average
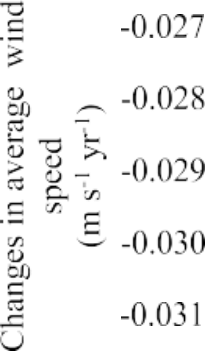
wind speed in all areas of the Sanjiang Plain had a decreasing trend (Fig. 11B). Moreover, the decreasing range of the average wind speed increased with the increase in the rice area proportion. The average wind speed in the Songnen Plain decreased in all counties. It decreased greatly in locations where rice areas increased greatly, and the decreasing range was the largest when the rice area proportion was more than 20% (Fig. 11A). The expansion of rice areas tends to cause the regional average wind speed to decline, which is consistent with the conclusions drawn by Han et al. (2009) and Jia et al. (2016). On the one hand, rice area expansion in Heilongjiang Province may change the surface roughness and have a significant blocking effect on wind speed. On the other hand, the significant increase in irrigation caused a sig- nificant temperature and humidity difference with the surrounding area, thus affecting the local wind circulation (Alpert and Mandel, 1986; Ozdogan and Salvucci, 2004).
Precipitation in the counties of the Songnen Plain and Sanjiang Plain increased from 1980 to 2018 (Fig. 12). The increasing range was the largest when the rice area proportion was more than 20% in Sanjiang Plain. The impact of irrigation on precipitation is very complex. There is no obvious relationship between the changes of precipitation in different regions and the proportion of rice area. The impact of rice area expan- sion on regional precipitation is not clear.
![]()
![]()
![]()
![]()
![]()
![]()
![]()
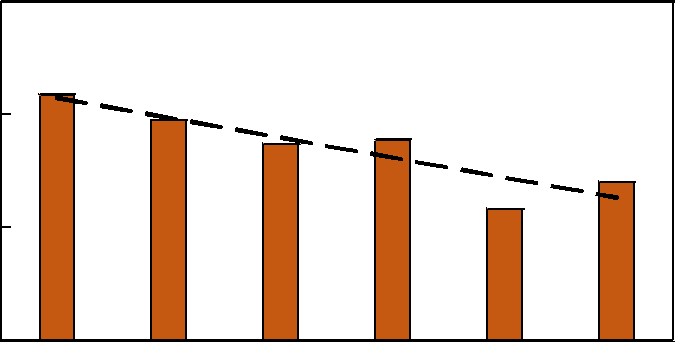 Fig. 7. Rice areas changes during 1980–2018.
![]()
![]()
![]()
![]()
![]()
![]()
![]()
![]()
![]()
![]()
![]()
![]()
![]()
![]()
![]()
![]()
![]()
![]()
![]()
![]()
![]()

 Fig. 8. Changes in average temperature in the Songnen Plain (A) and Sanjiang Plain (B) at different expansion levels.
![]()
![]()
![]()
![]()
![]()
![]()
![]()
![]()
![]()
![]()
![]()
![]()
![]()
![]()
![]()
![]()
![]() Fig. 9. Changes in average relative humidity in the Songnen Plain (A) and Sanjiang Plain (B) at different expansion levels.
Fig. 9. Changes in average relative humidity in the Songnen Plain (A) and Sanjiang Plain (B) at different expansion levels.
![]()
![]()
![]()
![]()
![]()
![]()
![]()
![]()
![]()
![]()
![]()
![]()
![]()
![]()
![]()
![]()
![]()
![]()
![]()
![]()
![]()
![]()
![]()
![]()
![]()
![]()
![]()
![]()

![]()
![]()

![]()
![]()
![]()
![]()
![]()
![]()
![]()
![]()
![]()
![]()

![]()
![]()
![]()
![]()
![]()
![]()

 Fig. 10. Changes in sunshine duration in the Songnen Plain (A) and Sanjiang Plain (B) at different expansion levels.
![]()
![]()
Fig. 11. Changes in average wind speed in the Songnen Plain (A) and Sanjiang Plain (B) at different expansion levels.
![]()
![]()
![]()
![]()
![]()
![]()
![]()
![]()
![]()
![]()
![]()
![]()
![]()
![]()
![]()
![]()
![]()
![]()
![]()

![]()
![]()
![]()
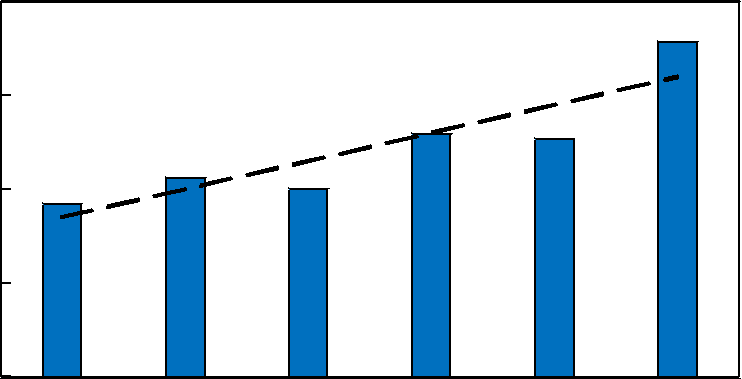

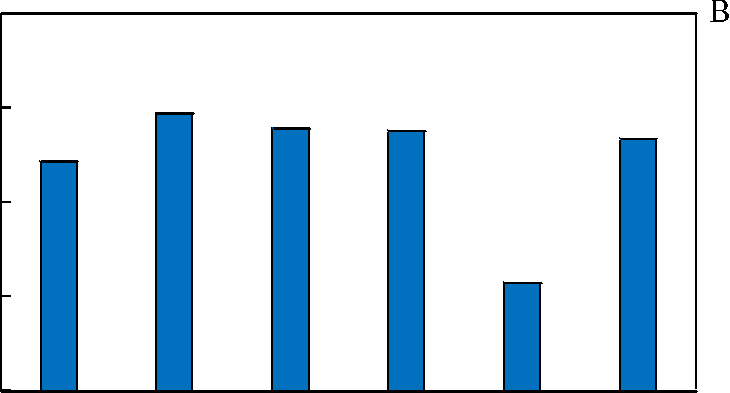 Fig. 12. Changes in precipitation in the Songnen Plain (A) and Sanjiang Plain (B) at different expansion levels.
![]()
![]()
![]()
![]()
![]()
![]()
![]()
![]()
![]()
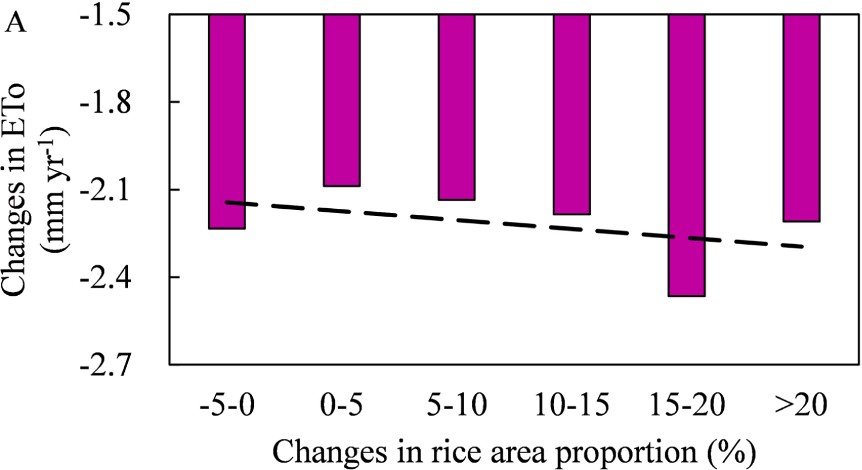
![]() Fig. 13. Changes in ETo in the Songnen Plain (A) and Sanjiang Plain (B) at different expansion levels.
Fig. 13. Changes in ETo in the Songnen Plain (A) and Sanjiang Plain (B) at different expansion levels.
![]()
![]()
![]()
![]()
![]()
![]()
![]()
![]()
![]()
![]()
![]()
![]()
![]()
![]()
![]()
![]()
![]()
![]()
![]()
![]()
![]()
![]()
![]()
![]()
![]()
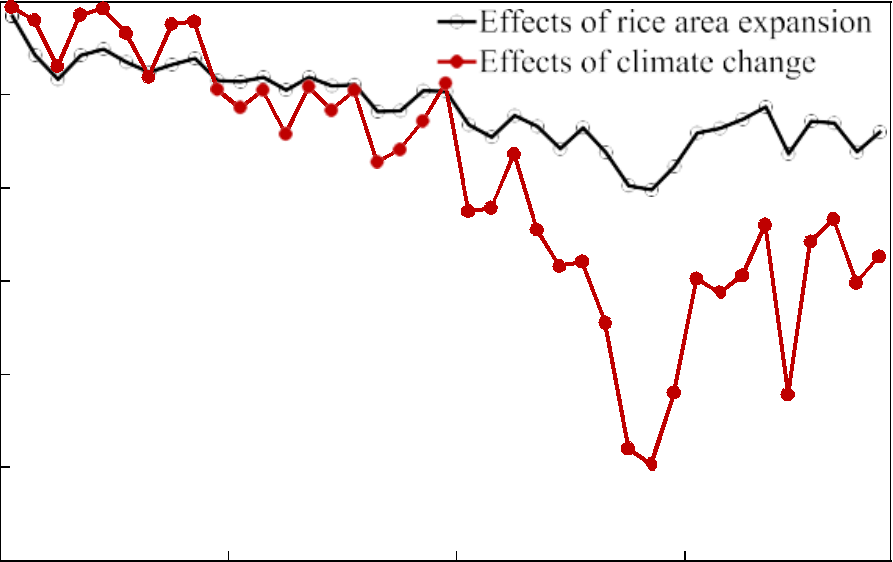
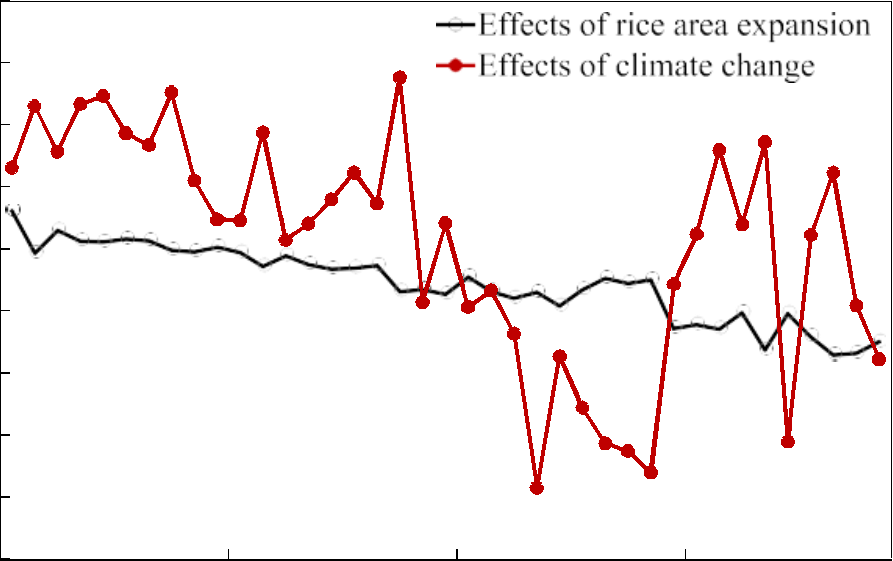
![]() Fig. 14. Effects of rice area expansion and climate change on ETo in the Songnen Plain (A) and Sanjiang Plain (B).
Fig. 14. Effects of rice area expansion and climate change on ETo in the Songnen Plain (A) and Sanjiang Plain (B).
ETo in the counties of the two plains decreased (Fig. 13). As the proportion of rice areas increased gradually, the decline in ETo in the Songnen Plain increased. Combined with the results of correlation analysis, slowing down the rise in average temperature, increasing the average relative humidity and slowing down the wind speed may lead to the decrease of ETo. The larger the proportion of irrigated area is, the greater the influence on evapotranspiration (Han et al., 2009; Jia et al., 2016). The trend may not be strict because the influence between adjacent areas cannot be ignored.
3.4. Contributions of climate change and rice area expansion to ETo trends
Fig. 14 shows that both rice area expansion and climate change in
Sanjiang and Songnen Plain can reduce ETo. The cumulative impact of rice area expansion and climate change on ETo in Sanjiang Plain reached
![]() 12.49 mm yr—1 and 13.89 mm yr—1 respectively; whereas, the cor-
12.49 mm yr—1 and 13.89 mm yr—1 respectively; whereas, the cor-
![]() responding values in Songnen Plain were 13.93 and 27.30 mm yr—1. According to the impacts of rice area expansion and climate change on ETo, the contribution of rice area expansion in Songnen Plain to the decline of ETo was 33.79% and that of climate change was 66.21%. Rice
responding values in Songnen Plain were 13.93 and 27.30 mm yr—1. According to the impacts of rice area expansion and climate change on ETo, the contribution of rice area expansion in Songnen Plain to the decline of ETo was 33.79% and that of climate change was 66.21%. Rice
area expansion and climate change in the Sanjiang Plain contributed 47.33% and 52.67% to the decline in ETo, respectively.
 The response of ETo in Sanjiang Plain to rice area expansion was even smaller than that in Songnen Plain, which is inconsistent with the hypothesis that larger rice area expansion has greater influence on evapotranspiration (Han et al., 2009). About 25.80% of the rice fields in Sanjiang Plain converted from wetlands and 48.15% from dry fields (Fig. 15). The impacts of these two land use and land cover changes on ETo may be different.
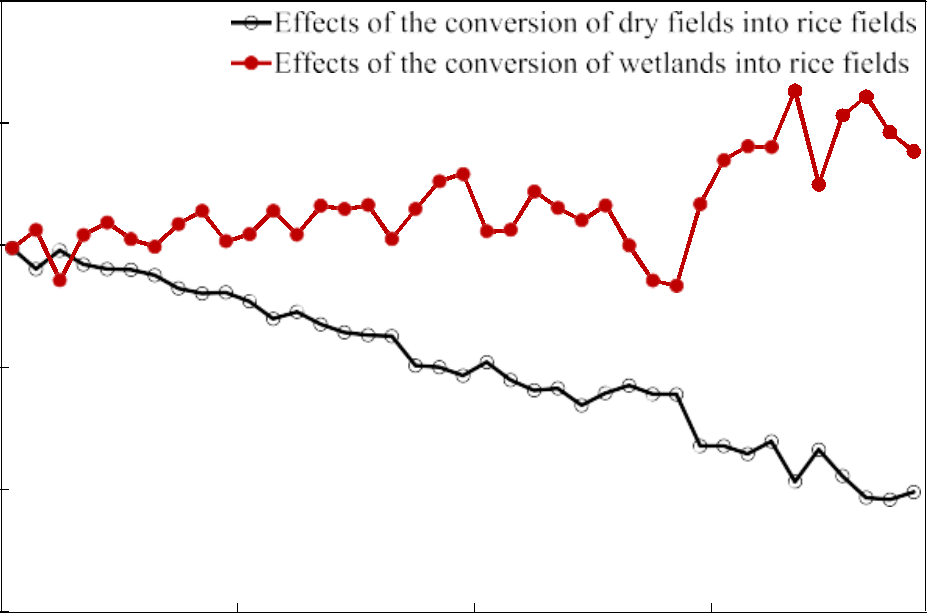
The changes in ETo in dry fields converted to rice fields and wetlands converted to rice fields were extracted and analysed respectively. It was
found that wetlands converted to rice fields can increase ETo, with a cumulative effect of 7.67 mm yr—1. The transformation from dry fields
to rice fields can decrease ETo, with a cumulative reduction effect of
![]()
 20.15 mm yr—1 (Fig. 16). ETo had a greater response to the trans- formation of dry fields into rice fields. The impact of rice area expansion in Sanjiang Plain was still dominated by decline ETo, and the decline was small. These findings are conducive to discussing the effect of rice area expansion on the ecological environment and strengthening the rational use of land resources. The expansion of rice areas played a role in decreasing regional ETo.
This study analysed the spatio-temporal dynamics of ETo and rice areas in Heilongjiang Province from 1951 to 2018 and evaluated the relationship among ETo, rice area and climate change. The conclusions are as follows:
(1) ETo in Heilongjiang Province decreased slightly, and the linear
![]() trend was 0.08 mm yr—1. Moreover, the area of high ETo gradu- ally decreased. Rice areas in Heilongjiang Province continued to
trend was 0.08 mm yr—1. Moreover, the area of high ETo gradu- ally decreased. Rice areas in Heilongjiang Province continued to
![]() grow at a rate of 0.54 105 ha yr—1. Rice area increased signifi-
grow at a rate of 0.54 105 ha yr—1. Rice area increased signifi-
cantly from 1980 to 2018.
(2) ETo in Heilongjiang Province was positively correlated with average temperature, sunshine duration and average wind speed and negatively correlated with average relative humidity and precipitation. During the study period, ETo was greatly affected by sunshine duration and average wind speed in Heilongjiang Province.
(3) Rice area expansion and climate change in Heilongjiang Province reduced ETo. The contributions of rice area expansion and climate change to the reduction in ETo were 47.33% and 52.67% on the Sanjiang Plain and 33.79% and 66.21% on the Songnen Plain, respectively. Rice area expansion may slow the increase in tem- perature, increase the average relative humidity and reduce the average wind speed. These changes may be the direct causes of the decrease in ETo. Wetlands conversion to rice fields had an increased effect on ETo, while dry fields conversion to rice fields had a decreased effect on ETo, with cumulative effects of
7.67 mm yr—1 and —20.15 mm yr—1 in Sanjiang Plain respectively.
Declaration of Competing Interest
The authors declare that they have no known competing financial interests or personal relationships that could have appeared to influence the work reported in this paper.
![]()
![]()
![]()
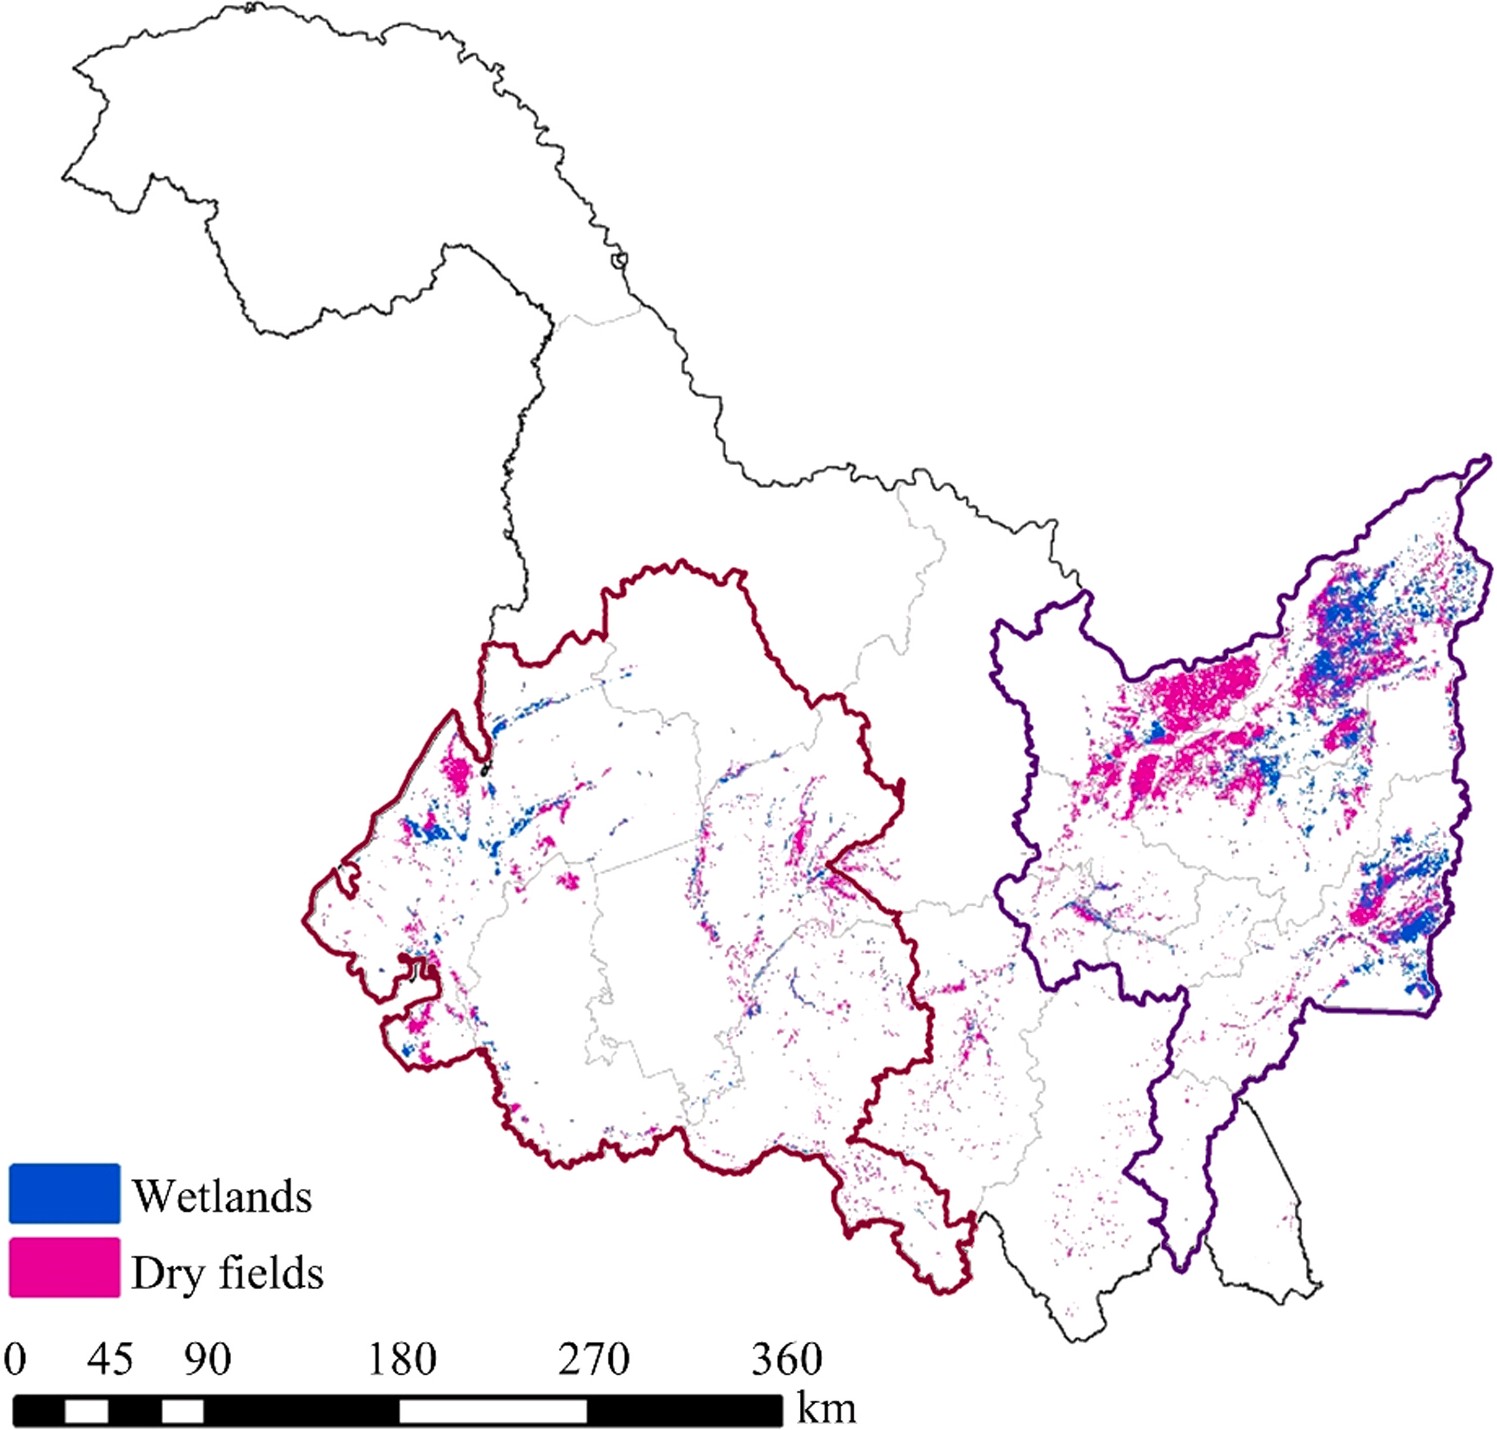
Fig. 15. Rice fields converted from wetlands and dry fields.
![]()
 gov.cn) and the land use information provided by Date Center for Re- sources and Environmental Sciences, Chinese Academy of Sciences (http://www.resdc.cn) are gratefully acknowledged.
![]()
![]() Allen, R.G., Pereira, L.S., Raes, D., Smith, M., 1998. Crop evapotranspiration: guidelines for computing crop water requirements. FAO Irrigation and Drainage Paper No. 56. FAO, Rome, Italy. https://doi.org/10.1016/j.eja.2010.12.001.
Allen, R.G., Pereira, L.S., Raes, D., Smith, M., 1998. Crop evapotranspiration: guidelines for computing crop water requirements. FAO Irrigation and Drainage Paper No. 56. FAO, Rome, Italy. https://doi.org/10.1016/j.eja.2010.12.001.
Alpert, P., Mandel, M., 1986. Wind variability—an indicator for a mesoclimatic change in Israel. J. Appl. Meteorol. Clim. 25 (11), 1568–1576. https://doi.org/10.1175/ 1520-0450(1986)025<1568:wvifam>2.0.co;2.
![]() Bonfils, C., Lobell, D., 2007. Empirical evidence for a recent slowdown in irrigation- induced cooling. P. Natl. Acad. Sci. U.S.A. 104 (34), 13582–13587. https://doi.org/ 10.1073/pnas.0700144104.
Bonfils, C., Lobell, D., 2007. Empirical evidence for a recent slowdown in irrigation- induced cooling. P. Natl. Acad. Sci. U.S.A. 104 (34), 13582–13587. https://doi.org/ 10.1073/pnas.0700144104.
![]() Bureau of Statistics of Heilongjiang State Bureau of Agriculture Reclamation, 1993. Statistical Yearbook of Heilongjiang State Farms. China Statistics Press, Beijing, 1993-2019. http://tjj.hlj.gov.cn/tjsj/tjnj/.
Bureau of Statistics of Heilongjiang State Bureau of Agriculture Reclamation, 1993. Statistical Yearbook of Heilongjiang State Farms. China Statistics Press, Beijing, 1993-2019. http://tjj.hlj.gov.cn/tjsj/tjnj/.
![]()
![]()
![]()
![]() Chen, H., Zhang, W.C., Gao, H.R., Nie, N., 2018. Climate change and anthropogenic impacts on wetland and agriculture in the songnen and sanjiang plain. Remote Sens. 10 (3), 356. https://doi.org/10.3390/rs10030356.
Chen, H., Zhang, W.C., Gao, H.R., Nie, N., 2018. Climate change and anthropogenic impacts on wetland and agriculture in the songnen and sanjiang plain. Remote Sens. 10 (3), 356. https://doi.org/10.3390/rs10030356.
![]()
![]()
![]()
Fig. 16. Effects of the conversion of dry fields and wetlands into rice fields on ETo in the Sanjiang Plain.
This study was financially supported by the National Natural Science Foundation of China (No. 51979201), the Water Resources S&T Project of Inner Mongolia Autonomous Region, China (No. NSK 2021-01) and the Department of Science and Technology of Hubei Province, China under the S&T Cooperation with Foreign Country Project (No. 2019AHB076). The observed meteorological data obtained from the China Meteorological Data Sharing Service System (http://data.cma.
Chen, J., Yu, Z., Zhu, Y., Yang, C., 2011. Relationship between land use and evapotranspiration-a case study of the Wudaogou area in Huaihe River Basin. Procedia Environ. Sci. 10, 491–498. https://doi.org/10.1016/j.proenv.2011.09.080.
Chen, Y., Wang, S., Ren, Z., Huang, J., Wang, X., Liu, S., Deng, H., Lin, W., 2019.
Increased evapotranspiration from land cover changes intensified water crisis in an arid river basin in northwest China. J. Hydrol. 574, 383–397. https://doi.org/ 10.1016/j.jhydrol.2019.04.045.
Chen, S.L. , Huo, Z.L. , 2016. Research on the effect of climate change on reference evapotranspiration in the Heihe River Basin during the last 53 years. China Rural Water and Hydropower. 5, 81–91 (in Chinese with English abstract). http://www. cnki.com.cn/Article/CJFDTotal-ZNSD201605020.htm.
Dalezios, N.R., Loukas, A., Bampzelis, D., 2002. Spatial variability of reference evapotranspiration in Greece. Phys. Chem. Earth 27, 1031–1038. https://doi.org/ 10.1016/S1474-7065(02)00139-0.
Dias, L.C.P., Macedo, M.N., Costa, M.H., Coe, M.T., Neill, C., 2015. Effects of land cover change on evapotranspiration and streamflow of small catchments in the upper
![]()
![]()
![]()
Xingu River Basin, Central Brazil. J. Hydrol.Reg. Stud. 4, 108–122. https://doi.org/ 10.1016/j.ejrh.2015.05.010.
Gao, G., Chen, D., Ren, G., Chen, Y., Liao, Y., 2006. Trend of potential evapotranspiration over China during 1956 to 2000. Geogr. Res. 25 (3), 378–387 (in Chinese with English abstract). http://d.wanfangdata.com.cn/periodical/dlyj200603002.
Gao, J., Liu, Y., 2011. Climate warming and land use change in Heilongjiang Province, Northeast China. Appl. Gengr. 31, 476–482. https://doi.org/10.1016/j. apgeog.2010.11.005.
Gao, S., Nie, S., Liu, Q., Liu, Y., Chang, H., Ma, C., Liu, B., Wang, C., Xu, J., Xu, M., Men,
L., Sun, Z., Zong, T., Yang, G., Shi, S., Xiong, Y., 2020. Analysis of current situation of rice industry in Heilongjiang Province and Its Future Development Ideas. China Rice. 26, 104–106 (in Chinese with English abstract). http://www.cnki.com.cn/Articl e/CJFDTotal-DAOM202002027.htm.
Han, S., Hu, H., 2012. Spatial variations and temporal changes in potential evaporation in the Tarim Basin, Northwest China (1960–2006): influenced by irrigation? Hydrol. Process. 26 (20), 3041–3051. https://doi.org/10.1002/hyp.8326.
Han, S., Yang, Z., 2013. Cooling effect of agricultural irrigation over Xinjiang, Northwest China from 1959 to 2006. Environ. Res. Lett. 8 (2), 24–39. https://doi.org/10.1088/ 1748-9326/8/2/024039.
Han, S., Hu, H., Yang, D., Liu, Q., 2009. Differences in changes of potential evaporation in the mountainous and oasis regions of the Tarim Basin, Northwest China. Sci.
China Ser. E 39, 1375–1383. https://doi.org/10.1007/s11431-009-0123-3.
Han, S., Liu, Q., Hu, H., Yang, D., 2010. Impacts of irrigation on annual potential evapotranspiration in Jingtai irrigation district. Adv. Water Sci. 21 (3), 364–369 (in Chinese with English abstract). http://d.wanfangdata.com.cn/periodical/skxjz 201003011.
Han, S., Xu, D., Wang, S., Yang, Z., 2014. Water requirement with irrigation expansion in Jingtai Irrigation District, Northwest China: the need to consider irrigation-induced local changes in evapotranspiration demand. J. Irrig. Drain. Eng. 140 (2), 04013009 https://doi.org/10.1061/(asce)ir.1943-4774.0000671.
Han, S., Tang, Q., Xu, D., Yang, Z., 2018. Impacts of urbanization and agricultural development on observed changes in surface air temperature over mainland China from 1961 to 2006. Theor. Appl. Climatol. 135, 1595–1607. https://doi.org/ 10.1007/s00704-018-2461-1.
Heilongjiang Bureau of Statistics, 1987. Heilongjiang Statistical Yearbook. China Statistics Press, Beijing, 1987-2019. http://tjj.hlj.gov.cn/tjsj/tjnj/.
![]()
![]() Hou, W., Geng, T., Chen, Q., Chen, C., 2015. Impacts of climate warming on growth period and yield of rice in Northeast China during recent two decades. Chin. J. Appl. Ecol. 26, 249–259 (in Chinese with English abstract). http://www.cnki.com.cn/ Article/CJFDTotal-YYSB201501034.htm .
Hou, W., Geng, T., Chen, Q., Chen, C., 2015. Impacts of climate warming on growth period and yield of rice in Northeast China during recent two decades. Chin. J. Appl. Ecol. 26, 249–259 (in Chinese with English abstract). http://www.cnki.com.cn/ Article/CJFDTotal-YYSB201501034.htm .
Jia, Y., Cui, N., Wei, X., Hu, X., Gong, D., Feng, Y., 2016. Impact of climate change and irrigation on the reference crop evapotranspiration in Dujiangyan Irrigated Area.
J. Sichuan Univ. Eng. Sci. Ed. 48, 69–79 (in Chinese with English abstract). http://www.cnki.com.cn/Article/CJFDTotal-SCLH2016S1011.htm.
Jo´dar, J., Carrera, J., Cruz, A., 2010. Irrigation enhances precipitation at the mountains downwind. Hydrol. Earth Syst. Sc. 14 (10), 2003–2010. https://doi.org/10.5194/ hess-14-2003-2010.
Kang, C.H., Zhang, Y., Wang, Z., Liu, L., Zhang, H., Yilgwang, J., 2017. The driving force analysis of NDVI dynamics in the trans-boundary tumen river basin between 2000 and 2015. Sustainability 9 (12), 2350. https://doi.org/10.3390/su9122350.
Kendall, M.G. , 1975. Rank Correlation Methods. Griffin, London. https://doi.org/1 0.1111/j.2044-8317.1956.tb00172.x.
![]()
![]() Kong, F.D., Zhang, Z.H., Wang, Z.F., 2018. Reference crop evapotranspiration spatio- temporal variation in semi-humid and semi-arid areas of Liaoning Province. Sci. Technol. Eng. 18, 227–231 (in Chinese with English abstract). http://www.cqvip. com/QK/84018X/201815/675814607.html .
Kong, F.D., Zhang, Z.H., Wang, Z.F., 2018. Reference crop evapotranspiration spatio- temporal variation in semi-humid and semi-arid areas of Liaoning Province. Sci. Technol. Eng. 18, 227–231 (in Chinese with English abstract). http://www.cqvip. com/QK/84018X/201815/675814607.html .
Koster, R.D., 2004. Regions of strong coupling between soil moisture and precipitation.
Science 305, 1138–1140. https://doi.org/10.1126/science.1100217.
Li, B., Wang, P.Z., Chi, D.C., Han, L.L., 2015. Sensitivity of reference evapotranspiration in Fuxin, Liaoning based on meteorological factors. Jiangsu Agric. Sci. 43, 281–283 (in Chinese). http://d.wanfangdata.com.cn/periodical/jsnykx201503093.
Li, G., Zhang, F., Jing, Y., Liu, Y., Sun, G., 2017. Response of evapotranspiration to changes in land use and land cover and climate in china during 2001–2013. Sci. Total Environ. 256, 596–597. https://doi.org/10.1016/j.scitotenv.2017.04.080.
Lin, P.F., He, Z.B., Du, J., Chen, L.F., Zhu, X., Li, J., 2018. Impacts of climate change on reference evapotranspiration in the Qilian Mountains of China: historical trends and projected changes. Int. J. Climatol. 38, 2980–2993. https://doi.org/10.1002/ joc.5477.
Liu, Z., Li, Z., Tang, P., Li, Z., Wu, W., Yang, P., You, L., Tang, H., 2013. Spatial-temporal changes of rice area and production in China during 1980-2010. Acta Geogr. Sin. 68, 680–693 (in Chinese with English abstract). http://www.cnki.com.cn/Articl e/CJFDTotal-DLXB201305012.htm.
Lobell, D., Bala, G., Mirin, A., Phillips, T., Maxwell, R., Rotman, D., 2009. Regional differences in the influence of irrigation on climate. J. Clim. 22 (8), 2248–2255. https://doi.org/10.1175/2008JCLI2703.1.
Lu, Z., Song, Q., Liu, K., Wu, W., Liu, Y., Xin, R., Zhang, D., 2017. Rice cultivation changes and its relationships with geographical factors in Heilongjiang Province, China. J. Integr. Agr. 16 (10), 2274–2282. https://doi.org/10.1016/S2095-3119(17)
Luo, P., Mu, D., Xue, H., Ngo-Duc, T., Dang-Dinh, K., Takara, K., Nover, D., Schladow, G., 2018. Flood inundation assessment for the Hanoi Central Area, Vietnam under historical and extreme rainfall conditions. Sci. Rep. 8, 612–623. https://doi.org/ 10.1038/s41598-018-30024-5.
Lv, Q., Liu, H., Zhang, R., An, D., 2019. Spatio-temporal aspects of carbon dioxide emissions due to rail transport of coal in China. Transport 1–24. https://doi.org/ 10.1680/jtran.17.00146.
Lv, Y., Xu, J., Yang, S., Liu, X., Zhang, J., Wang, Y., 2018. Inter-seasonal and cross- treatment variability in single-crop coefficients for rice evapotranspiration estimation and their validation under drying-wetting cycle conditions. Agric. Water Manag. 196, 154–161. https://doi.org/10.1016/j.agwat.2017.11.006.
Mann, H.B., 1945. Nonparametric tests against trend. Econometrica 13, 245–259. https://doi.org/10.2307/1907187.
Mao, H.Q., Yan, X.D., Xiong, Z., Tian, H.Q., 2011. Modeled impact of irrigation on regional climate in India. Acta Ecol. Sin. 31, 1038–1045 (in Chinese with English abstract). http://d.wanfangdata.com.cn/periodical/stxb201104016.
Moghbeli, A., Delbari, M., Amiri, M., 2020. Application of a standardized precipitation index for mapping drought severity in an arid climate region, southeastern Iran. Arab. J. Geosci. 13 (5), 221. https://doi.org/10.1007/s12517-020-5201-7.
Nam, W., Hong, E., Choi, J., 2016. Assessment of water delivery efficiency in irrigation canals using performance indicators. Irrig. Sci. 34, 129–143. https://doi.org/ 10.1007/s00271-016-0488-6.
Nam, W.H., Hong, E.M., Choi, J.Y., 2015. Has climate change already affected the spatial distribution and temporal trends of reference evapotranspiration in south korea? Agric. Water Manag. 150, 129–138. https://doi.org/10.1016/j.agwat.2014.11.019.
Nan, J., Xiao, J., Liu, Z., 2012. Research on reference crop evaporation’s variation with time series in Northeast Region. Water Sav. Irrig. 37, 15–17 (in Chinese with English abstract). http://www.cnki.com.cn/Article/CJFDTotal- JSGU201201006.htm.
Nie, T., Zhang, Z., Qi, Z., Chen, P., Lin, Y., Sun, Z., 2019. Spatial and temporal distribution characteristics of rice water requirement in Heilongjiang Province during 1960-2015. Trans. Chin. Soc. Agric. Mach. 50, 279–290 (in Chinese with English abstract). http://www.cnki.com.cn/Article/CJFDTotal-NYJX201905032. htm.
Odongo, V.O., van Oel, P.R., van der Tol, C., Su, Z., 2019. Impact of land use and land cover transitions and climate on evapotranspiration in the lake Naivasha Basin, Kenya. Sci. Total Environ. 682, 19–30. https://doi.org/10.1016/j. scitotenv.2019.04.062.
Oliver, M.A., Webster, R., 1990. Kriging: a method of interpolation for geographical information systems. Int. J. Geogr. Inf. Syst. 4, 313–332. https://doi.org/10.1080/ 02693799008941549.
Ozdogan, M., Salvucci, G.D., 2004. Irrigation-induced changes in potential evapotranspiration in southeastern turkey: test and application of Bouchet’s complementary hypothesis. Water Resour. Res. 40 (4), 130–141. https://doi.org/ 10.1029/2003WR002822.
Pour, S.H., Wahab, A.K.A., Shahid, S., Ismail, Z.B., 2020. Changes in reference evapotranspiration and its driving factors in peninsular malaysia. Atmos. Res. 246, 105096 https://doi.org/10.1016/j.atmosres.2020.105096.
Puma, M.J., Cook, B.I., 2010. Effects of irrigation on global climate during the 20th century. J. Geophys. Res. 115, D16120 https://doi.org/10.1029/2010JD014122.
Qiu, R., Liu, C., Cui, N., Wu, Y., Wang, Z., Li, G., 2019. Evapotranspiration estimation using a modified Priestley-Taylor model in a rice-wheat rotation system. Agric.
Water Manag. 224, 105755 https://doi.org/10.1016/j.agwat.2019.105755.
Revadekar, J.V., Tiwari, Y.K., Kumar, K.R., 2012. Impact of climate variability on NDVI over the Indian region during 1981–2010. Int. J. Remote. Sens. 33, 7132–7150. https://doi.org/10.1080/01431161.2012.697642.
Roderick, M.L., Farquhar, G.D., 2002. The cause of decreased pan evaporation over the past 50 years. Science 298 (5597), 1410–1411. https://doi.org/10.1126/ science.1075390.
Sacks, W.J., Cook, B.I., Buenning, N., 2009. Effects of global irrigation on the near- surface climate. Clim. Dyn. 33 (2–3), 159–175. https://doi.org/10.1007/s00382- 008-0445-z.
Scheff, J., Frierson, D.M.W., 2014. Scaling potential evapotranspiration with greenhouse warming. J. Clim. 27 (4), 1539–1558. https://doi.org/10.1175/JCLI-D-13-00233.1.
Su, J.W., Zhang, X.L., Shen, B., 2021. Spatial and temporal variation characteristics and influencing factors of potential evapotranspiration in Heilongjiang Province.
Heilongjiang Hydraul. Sci. Technol. 49 (01), 1–8. https://doi.org/10.14122/j.cnki. hskj.2021.01.001 (in Chinese with English abstract).
Sun, J., Qin, X., 2016. Precipitation and temperature regulate the seasonal changes of NDVI across the Tibetan Plateau. Environ. Earth Sci. 75 (4), 291. https://doi.org/ 10.1007/s12665-015-5177-x.
Tang, X., Song, N., Chen, Z., Wang, J., He, J., 2018. Estimating the potential yield and ETc of winter wheat across Huang-Huai-Hai Plain in the future with the modified DSSAT model. Sci. Rep. 8 (1), 15370. https://doi.org/10.1038/s41598-018-32980-
4.
Xie, P., Chen, X.H., Liu, B.J., Liu, M.C., 2008. Changes of reference evapotranspiration and pan evaporation in Dongjiang River Basin. J. Irrig. Drain. 5, 14–17 (in Chinese with English abstract). http://www.cnki.com.cn/Article/CJFDTotal-GGPS2008 05004.htm.
Xie, R., Cui, N., Hu, X., Gong, D., Lu, Z., 2017. Spatial and temporal characteristics of reference crop evapotranspiration in the main grain production area of China from 1961 to 2013. Adv. Eng. Sci. 49, 16–24 (in Chinese with English abstract). http://www.cnki.com.cn/Article/CJFDTOTAL-SCLH2017S2003.htm.
Yassen, A.N., Nam, W.H., Hong, E.M., 2020. Impact of climate change on reference evapotranspiration in Egypt. Catena 194, 104711. https://doi.org/10.1016/j. catena.2020.104711.
Yavuz, S.G., 2018. Multiple S¸ en-innovative trend analyses and partial Mann-Kendall test.
J. Hydrol. 566, 685–704. https://www.sciencedirect.com/science/article/pii/ S0022169418307285.
Zhang, G.L., Xu, X.L., Zhou, C.P., Zhang, H.B., Ouyang, H., 2011. Responses of grassland vegetation to climatic variations on different temporal scales in Hulun Buir Grassland in the past 30 years. J. Geogr. Sci. 21 (4), 634–650. https://doi.org/ 10.1007/s11442-011-0869-y (in Chinese with English abstract).
![]()
![]()
![]()
Zhang, H.B., Wang, B., Xin, C., Lan, T., 2016. Effects of trend-free pre-whitening methods on trend detection in Mann-Kendall test of runoff series. J. Hydroelectr. Eng. 35 (12), 56–69. https://doi.org/10.11660/slfdxb.20161206 (in Chinese with English abstract).
Zhang, Lj, Yu, Y., Su, ll, Hao, Tt, Zheng, H., 2017. Effects of land use change on air temperature of Heilongjiang province in 1960-2010. Geogr. Sci. 37 (06), 952–959. https://doi.org/10.13249/j.cnki.sgs.2017.06.018 (in Chinese with English abstract).
Zhao, N., Han, S., Xu, D., Wang, J., Yu, H., 2016. Cooling and wetting effects of agricultural development on Near-Surface atmosphere over Northeast China. Adv. Meteorol. 2016, 1–12. https://doi.org/10.1155/2016/6439276.
Zhao, Z., Wang, H., Wang, C., Li, W., Chen, H., Deng, C., 2020. Changes in reference evapotranspiration over Northwest China from 1957 to 2018: variation characteristics, cause analysis and relationships with atmospheric circulation. Agric. Water Manag. 231, 105958 https://doi.org/10.1016/j.agwat.2019.105958.
![]()