
从三维角度预测CMIP6下中国未来气象干旱

![]()

 Agricultural Water Management 252 (2021) 106849
![]()
Projections of future meteorological droughts in China under CMIP6 from a ![]() three-dimensional perspective
three-dimensional perspective
Yang Xu, Xuan Zhang *, Zengchao Hao, Fanghua Hao, Chong Li
Beijing Key Laboratory of Urban Hydrological Cycle and Sponge City Technology, College of Water Sciences, Beijing Normal University, Beijing 100875, China
![]()
A R T I C L E I N F O
![]() Handling Editor: J.E. Fern´andez
Handling Editor: J.E. Fern´andez
![]() Keywords:
Keywords:
Drought events identification Spatiotemporal variation Copula
Drought return period
A B S T R A C T
![]()
In recent years, serious drought-related disasters in China have received increased attention due to their sig- nificant impacts. Assessing drought variations was critical to ensure agricultural activity, social development, and human health. This study used the three-dimensional clustering method to investigate variations of drought events in historical (1971–2010) and future (SSP126 and SSP585, 2061-2100) periods in China based on ob- servations and model simulations from Coupled Model Inter-comparison Project Phase 6 (CMIP6). The variations and risk analysis of drought characteristics were assessed by copula-based methods. Results indicated that precipitation was projected to increase by 12.0% and 19.5% for the SSP126 and SSP585 scenarios, respectively, with substantial increases in arid and semi-arid regions. The drought duration, severity, and affected area are shown to increase based on the CMIP6 projections compared with historical periods. We also assessed drought return periods of multiple drought characteristics for each scenario by using the copula-based joint distribution. Based on the joint analysis of duration, severity, and affected area for meteorological drought, both the “or” and “and” return periods in the future indicated increased risks. Under global warming, extreme drought events with long duration, high intensity, and extended affected area were shown to occur more frequently in the future, especially under the SSP585 scenario. These results can aid the understanding and characterization of drought events for drought risk management under global warming.
![]()
Droughts are among the most widespread climatic extremes and can damage ecosystems and cause deterioration of the land carbon sink (Schwalm et al., 2017). The Food and Agriculture Organization of the United Nations (FAO) has reported that drought disaster would lead to average losses between $250–300 billion per year and the numbers of such disasters along with their associated impacts on livelihoods and economies continue to increase significantly (FAO, 2018). In China, average annual drought losses totaled 4.2 billion US dollars from 1986 to 2005, which will soar with increasing drought intensities and areas (Su et al., 2018). With the wide attention to the potentially catastrophic consequences of global warming, many studies have shown that droughts will occur more frequently over wide areas around the globe (Zhao and Dai, 2017). Therefore, regional drought characteristics and risk analysis are critical to foster effective disaster risk management.
To provide policymakers with scientific assessments and put forward adaptation and mitigation options for climate change, many global meteorological high-resolution products of meteorological variables
have been invented (Abro et al., 2020b). Among them, the World Climate Research Programme (WCRP) launched the Coupled Model Intercomparison Project (CMIP) to contrast different carbon emission features simulated by general circulation models (GCMs). Simulations from CMIP5 and earlier versions have been widely used for evaluating drought variations for climate change impacts and potential risks in the future. By using GCMs models, Sheffield and Wood (2008) suggested that the northern hemisphere would get drier, while frequency of long-term droughts would increase more than three times over the next century. Dai et al (2018) also confirmed that the increased global average heavy precipitation probability and prolonged dry spells would occur simultaneously. In 2014, the WCRP launched a new phase, CMIP6 (Eyring et al., 2016), which aimed to address new scientific questions in the climate change field. It integrates the scientific combination sce- narios of Shared Socioeconomic Pathways (SSPs) and Representative Concentration Pathways (RCPs) into the impact of socio-economic development, and will provide more reliable results of climate change (O’Neill et al., 2016). Since the new GCMs in CMIP6 demonstrate their advantage for capturing the characteristics of large-scale precipitation
![]()
E-mail address: xuan@bnu.edu.cn (X. Zhang).
https://doi.org/10.1016/j.agwat.2021.106849
Received 19 October 2020; Received in revised form 4 February 2021; Accepted 2 March 2021
Available online 31 March 2021
0378-3774/© 2021 Elsevier B.V. All rights reserved.
![]()
![]()
patterns (Na et al., 2020; Xin et al., 2020), we assess the performance of the latest CMIP6 projections for drought analysis in our study.
Drought is commonly classified into four types, including meteoro- logical, agricultural, hydrological, and socio-economic drought (Mishra and Singh, 2010). Various indicators have been used to define a drought event. The Standardized Precipitation Index (SPI) (McKee et al., 1993) is among the most commonly used meteorological drought indicators for characterization of meteorological drought (Quiring, 2009; Mishra et al., 2009; Hao and AghaKouchak, 2013). Based on the definition of drought indicators, a series of properties including frequency, duration, and intensity can be defined for characterizing drought. To obtain drought characteristics from the index, Yevjevich (1967) introduced run theory, which can effectively detect the continuous features of a drought event (Saghafian and Mehdikhani, 2014; Ayantobo et al., 2018). How- ever, the run theory could only identify the drought event as one-dimensional (temporal) disaster (lacking the spatial information), which might result in the impractical measurements when information about multiple characteristics of drought is needed in different admin- istration units (counties, cities, states, etc.). To overcome this limitation, Andreadis et al. (2005) proposed an integrated spatial contiguity algo- rithm to characterize droughts at the spatial scale. Lloyd-Hughes (2012) improved the method for characterizing intrinsic three-dimensional space-time deficits from gridded precipitation data. In recent decades, the spatiotemporal structure-based approach for drought characteriza- tion has been commonly applied for drought characterization (Grillakis, 2019; Diaz et al., 2020; Han et al., 2021). This method has been used to describe the three-dimension (latitude, longitude, and time) character- istics of drought events in China during historical periods (Xu et al., 2015; Chen et al., 2019; Yang et al., 2020).
Due to the complexity of drought phenomena, univariate frequency
approaches cannot fulfil the requirements for drought characterizations (Shiau, 2006; Mishra and Singh, 2011). In the past few decades, re- searchers have proposed various methods for multivariate analysis of drought properties. Construction of multivariate distributions by cop- ulas has become a popular approach for identifying drought character- istics from a multivariate perspective (Shiau and Modarres, 2009; Song and Singh, 2010; Hao et al., 2017; Xiao et al., 2019). The advantage of this approach is that it can capture the dependence structure of marginal distributions among random variables independently and incorporate different drought features including duration, intensity, and severity. By
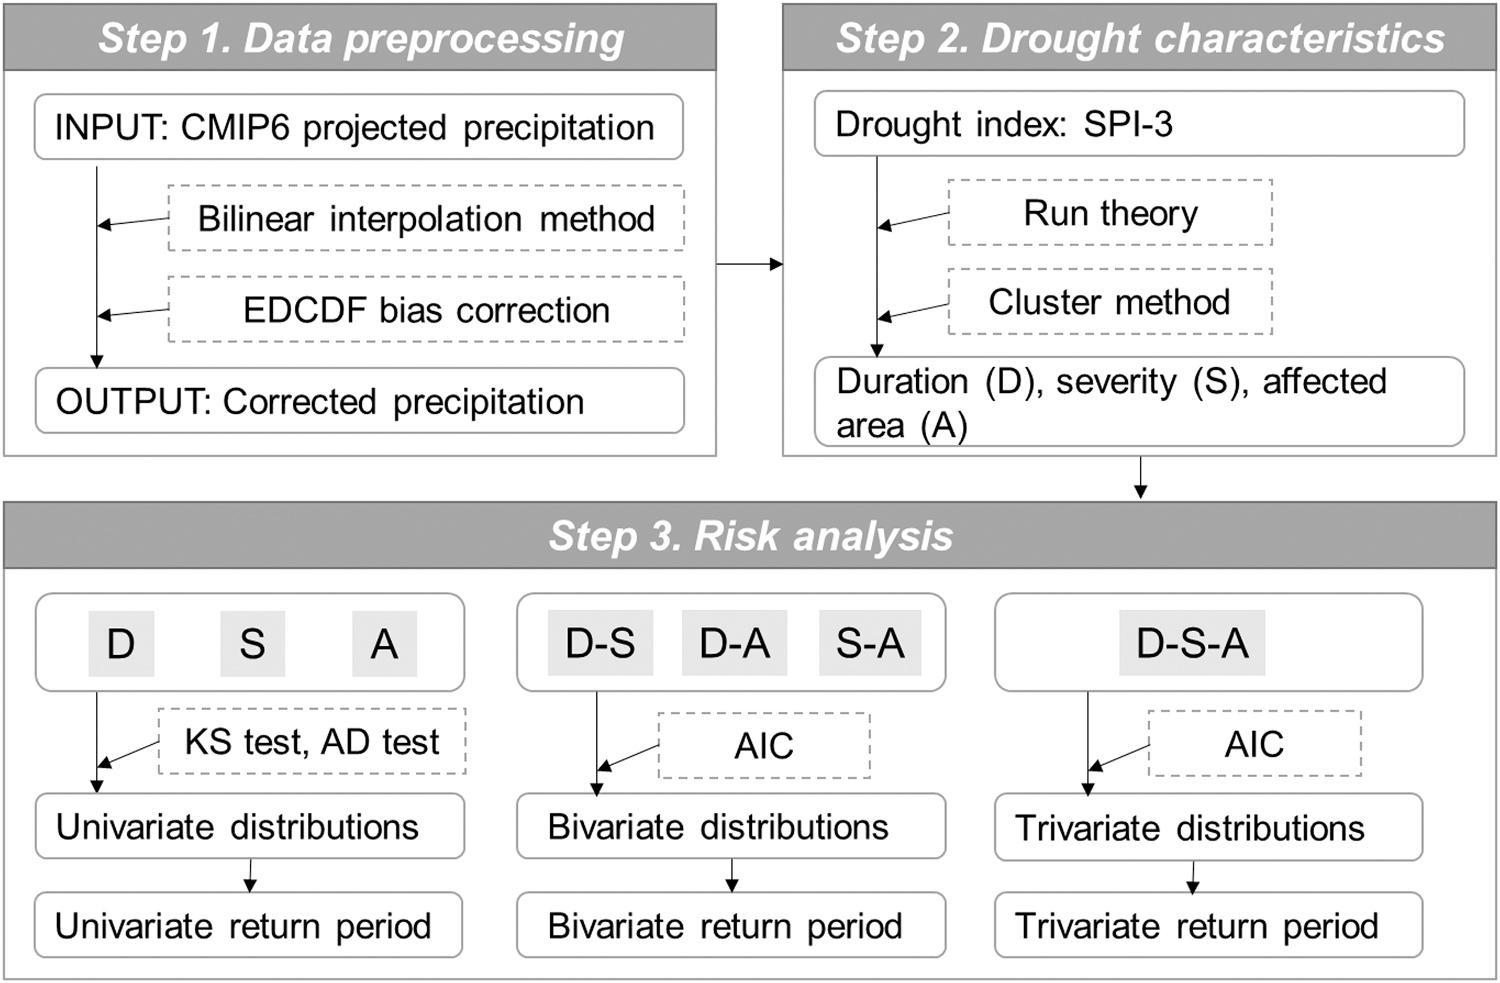
establishing a joint distribution of multiple drought characteristics, the risk of drought can be evaluated more comprehensively (Jha et al., 2019; Das et al., 2020). Traditional drought identification methods in previous studies focus on two dimensions (e.g., duration and severity), which makes it difficult to identify spatial information of droughts. The drought affected area is an essential index for calculating losses due to drought and is also useful for drought adaptation strategies (Lloyd-- Hughes, 2012). However, multivariate analyses of the drought charac- teristics of duration, severity, and affected area have been rather limited. This study aims to identify the variations in spatiotemporal distri- butions and risks of drought events in China under different scenarios, including historical (1971–2010), SSP126 (2061–2100), and SSP585 (2061–2100) (Sheffield and Wood, 2008; Dai et al., 2018). Firstly, CMIP6 model outputs were bias-corrected by statistical downscaling methods. Then, run theory and three-dimensional clustering methods were applied to identify drought events in China for both historical observations and future projections. Moreover, the copula-based multivariate distribution of drought properties was built to evaluate the conditional probability distribution and return period of drought events. The objectives therefore were (1) to evaluate the performance of GCMs (CMIP6) models in simulating precipitation in mainland China;
(2) to investigate changes in drought characteristics including duration
(D), severity (S), and affected area (A) for different scenarios; and (3) to evaluate the impact of climate change on multivariate drought return periods using the copula-based model (shown in Fig. 1).
2.1. Study area and data
This study was performed on mainland China, which is mostly located in the East Asian monsoon climatic zone. Each 40-year period was considered as a study period, for which 1971–2010 was the his- torical period and 2061–2100 was the future period. The observed
monthly precipitation datasets with 0.25◦ spatial resolution, were ob-
tained from the Institute of Geographic Sciences and Natural Resources Research, (CAS http://hydro.igsnrr.ac.cn/public/vic_outputs.html). Limited by resolution and data availability, 8 CMIP6 models (Table 1) with resolutions less than 100 km were selected to get to project future monthly precipitation from the World Climate Research Project (htt
![]()
![]()
![]()
![]()
![]() 1 BCC-CSM2-MR BCC China 320 × 160
1 BCC-CSM2-MR BCC China 320 × 160
2 CAMS-CSM1–0 CAMS China 320 × 160
3 FGOALS-f3-L CAS China 288 × 180
4 INM-CM5–0 INM France 180 × 120
5 FIO-ESM-2–0 FIO-QLNM China 288 × 192
6 MPI-ESM1–2-HR DKRZ Japan 320 × 160
7 CESM2-WACCM NCAR USA 288 × 180
8 GFDL-ESM4 NOAA-GFDL USA 288 × 192
ps://esgf-node.llnl.gov/projects/cmip6/).
2.2. Bias correction for the CMIP6 outputs
Downscaling with bias corrections has been shown to be an effective way to reduce inherent errors in the outputs of climate models (Fowler et al., 2007; Wilby et al., 2009). In this study, the precipitation data simulated by the CMIP6 climate models were firstly interpolated into a
![]() raster map (0.25◦ 0.25◦ resolution) by a bilinear interpolation
raster map (0.25◦ 0.25◦ resolution) by a bilinear interpolation
method. Then the equidistant cumulative distribution function (EDCDF) quantile-based mapping method (Li et al., 2010; Yang et al., 2019) was used to correct the precipitation resolution in China.
For the bias correction method, the cumulative distribution functions (CDF) of historical observations and future projections of different climate elements were constructed. The adjustment function for the correction can be summarized as follows (Li et al., 2010):
![]()
![]() xm—p.adjust = xm—p + F—1 (Fm—p (xm—p )) — F—1 (Fm—p (xm—p )) (1)
xm—p.adjust = xm—p + F—1 (Fm—p (xm—p )) — F—1 (Fm—p (xm—p )) (1)
where xm and x are the uncorrected and adjusted model pro-
where, rn and fn are the simulated and observed data respectively. σr and
σf are the standard deviation of rn and fn. The simulated data were more accurate when the R was closer to 1. Similarly, when the E and SD were closer to the observation point on the x-axis, smaller deviations between the simulated and observed data were presented.
2.3. Three-dimensional drought identification method
![]()
![]() The SPI (McKee et al., 1993) was employed to measure meteoro- logical drought over China. The SPI index was calculated by using pre- cipitation data over a user-defined accumulation period (3 month period was used in this study). Drought events in each grid during the study period were identified by run theory (Yevjevich, 1967). If the drought index in a certain period remained below a certain threshold ( 1 in this study), the run was regarded as a negative run and was likely to be a drought event. The drought events identified in each pixel were com- bined into a three-dimensional drought index array (DI) (nlat nlon nt). Specifically, nlat and nlon denote the number of grids along latitude and longitude, respectively, and nt denotes the number of months in the time dimension. The spatiotemporal three-dimensional drought identi- fication method developed by Lloyd-Hughes (2012) was introduced to build the monthly gridded drought index during the study periods. The aim of this method was to identify coherent time and space structures of DI. In this study, monthly drought patches were identified using a cluster method (Andreadis et al., 2005). Then, the connectivity of adjacent months was determined by the overlap area between two drought
The SPI (McKee et al., 1993) was employed to measure meteoro- logical drought over China. The SPI index was calculated by using pre- cipitation data over a user-defined accumulation period (3 month period was used in this study). Drought events in each grid during the study period were identified by run theory (Yevjevich, 1967). If the drought index in a certain period remained below a certain threshold ( 1 in this study), the run was regarded as a negative run and was likely to be a drought event. The drought events identified in each pixel were com- bined into a three-dimensional drought index array (DI) (nlat nlon nt). Specifically, nlat and nlon denote the number of grids along latitude and longitude, respectively, and nt denotes the number of months in the time dimension. The spatiotemporal three-dimensional drought identi- fication method developed by Lloyd-Hughes (2012) was introduced to build the monthly gridded drought index during the study periods. The aim of this method was to identify coherent time and space structures of DI. In this study, monthly drought patches were identified using a cluster method (Andreadis et al., 2005). Then, the connectivity of adjacent months was determined by the overlap area between two drought
patches (Lloyd-Hughes, 2012). Based on a sensitivity analysis, Wang
et al. (2011) found that an area threshold (A0) of 150,000 km2 was most
—p m—p.adjust
appropriate for China whose area is about 9.6 million km2. Next, all
jection value. Fo—c, Fm—c, and Fm—p are the CDF of precipitation data of current observation, current modeling, and model projection.
![]() Many studies have confirmed that the long time period precipitation data obey a gamma distribution (Li et al., 2010). Thus, a two-parameter gamma distribution was used in this study. Note that precipitation in dry regions may not follow a two-parameter gamma distribution due to the intermittent rainfall. Thus, a mixture model G x shown in Eq. (2) was introduced to calculate the CDF.
Many studies have confirmed that the long time period precipitation data obey a gamma distribution (Li et al., 2010). Thus, a two-parameter gamma distribution was used in this study. Note that precipitation in dry regions may not follow a two-parameter gamma distribution due to the intermittent rainfall. Thus, a mixture model G x shown in Eq. (2) was introduced to calculate the CDF.
G(x) = (1 — p)H(x) + pF(x) (2)
![]()
![]() where x denotes precipitation accumulation, p is the rate of months with rain. H x is a step function with a value of 0 in no rain months and a value of 1 in months with rain. F x is the two-parameter gamma dis- tribution (Eq. (3)) for the months with rain.
where x denotes precipitation accumulation, p is the rate of months with rain. H x is a step function with a value of 0 in no rain months and a value of 1 in months with rain. F x is the two-parameter gamma dis- tribution (Eq. (3)) for the months with rain.
drought events were identified as a series of drought patches in a continuous time series. Finally, to eliminate the impact of mild drought events, drought events with impact areas less than A0 and durations less than 3 months were excluded. Drought durations, severities, and affected areas were then calculated for each drought event (see (Xu et al., 2015) for details).
2.4. Copula-based drought modelling
Copula is a multivariate distribution function that connects different univariate marginal distributions (Nelsen, 1998). Copula has the advantage of flexible choice of arbitrary marginal distribution structures and is commonly used in disaster risk analysis (Janga Reddy and Ganguli, 2012; Chen et al., 2015). According to Sklar’s theorem (Sklar,
f (x;k, θ) = x
k—1 e—x/θ for x 0 and k θ 0 (3)
![]()
![]() ( )
( )
1959), a joint distribution F(x1, x2, ..., xN) with the univariate marginal distributions F1(x1), F2(x2), ..., FN(xN) can be written as:
![]()
![]()
where k and θ are the shape and scale parameters of the gamma distri- bution, respectively. These parameters can be estimated by the maximum likelihood estimation method.
The Taylor diagram (Taylor, 2001) was used to evaluate the varia- tions between simulated and observed precipitation data. The correla- tion coefficient (R), root mean square error (E), and standardized standard deviation (SD) were used to analyze the accuracy and deviation between the simulated and observed data (Abro et al., 2020a; Zhu et al., 2020), which were quantified as follow:
F(x1, x2, ..., xN ) = C[F1(x1), F2(x2), ..., FN (xN )] (7)
where C is an N-copula.
There are many kinds of copulas from different families such as the elliptical, Archimedean, and extreme-value copula families (Zhang and Singh, 2006). Gaussian and Student-t copulas are from the elliptical family and the Clayton, Frank, Gumbel, and Joe copulas are from the Archimedean family. These copulas were commonly used in the study of hydrological and meteorological disaster assessment and were also selected in this study. A number of univariate marginal distributions
![]()
1 ∑N
![]()
(fn — f )(rn — r)
(4)
were chosen, which included exponential, gamma, log-normal, log-lo-
![]()
![]()
![]() R = N i=1
R = N i=1
σf σr
gistic, generalized extreme value, generalized Pareto, and Weibull dis- tributions. The correlation between variables was evaluated to confirm
![]()
√̅1̅̅̅∑̅̅̅̅̅̅̅N̅̅̅̅̅̅̅̅̅̅̅̅̅̅̅̅̅̅̅̅̅̅2̅
whether a copula could be used and the goodness of fit (GOF) (Akaike,
E = N i=1 (fn — rn)
(5)
1974) tests were used to choose the best copula function. Based on the
selected copula, the multivariate return period of drought properties could be estimated.
![]()
![]()
For a bivariate copula, the joint probability distribution denoted as
F(x, y) = P(X ≤ x, Y ≤ y) = C[FX (x), FY (y) ] = C(u, v) (8)
![]() where u FX x and v FY y are marginal distributions of the random vector (X, Y).
where u FX x and v FY y are marginal distributions of the random vector (X, Y).
The return periods for both the “or” and “and” cases can be expressed as (Shiau, 2006):
2018). In the following section, the multivariate return periods in Eqs. (8)–(13) were used for the risk analysis of meteorological drought in China.
3.1. Performance of climate models
The Taylor diagram was used to evaluate the variations between
![]()
P(X ≥ x ∪ Y ≥ y) 1 — C(u, v)
E(L) E(L)
simulated precipitation data from 8 CMIP6 models and their average may be different from the observed meteorological data due to sys-
Tand (x, y) = P(X ≥ x ∩ Y ≥ y) = 1 — u — v + C(u, v) (10)
where E(L) is the average inter-arrival time of drought events in the observed sequence.
![]() For a trivariate copula, the joint distribution of F x, y, z can be
For a trivariate copula, the joint distribution of F x, y, z can be
expressed with copula C as:
F(x, y, z) = P(X ≤ x, Y ≤ y, Z ≤ z) = C[FX (x), FY (y), FZ (z) ]
= C(u, v, w) (11)
![]() where u FX x and v FY y , and w FZ z are the marginal distri- butions of the random vector (X, Y, Z).
where u FX x and v FY y , and w FZ z are the marginal distri- butions of the random vector (X, Y, Z).
The trivariate “or” and “and” return periods can be expressed as (Ma et al., 2013):
tematic errors (Fig. 2(a)). The results of corrected data using the EDCDF method were presented in Fig. 2(b), which showed that CMIP6 se- quences exhibited better accuracy after bias corrections. Furthermore, the better simulation accuracy was achieved for the average precipita- tion of the 8 models, which performed better after bias corrections with the R increased from 0.73 to 0.83 and E decreased from 55.0 to 42.6. Therefore, it can be used for projecting future meteorological conditions.
The projected scenarios would largely reshape the spatiotemporal characteristics of precipitation in China in future scenarios. Compared to the historical data (1971–2010), the annual average precipitation would increase by 12.0% and 19.5% under the SSP126 and SSP585 future emission scenarios (2061–2100), respectively (Fig. 3(a)). Spatially, the arid area in northwestern China would receive more precipitation in the future (Fig. 3(b) and (c)). Specifically, more rainfall is projected in
Tor (x, y, z) = E(L) = E(L)
(12)
Qinghai–Tibet Plateau while less precipitation would occur in the
P(X ≥ x ∪ Y ≥ y ∪ Z ≥ z)
![]() T x y z E(L)
T x y z E(L)
P(X ≥ x ∩ Y ≥ y ∩ Z ≥ z)
1 — C(u, v, w)
Sichuan Basin under the SSP585 scenario (Fig. 3(c)).
3.2. Projection of drought properties under CMIP6
![]() E(L)
E(L)
1 — u — v — w + C(u, v) + C(u, w) + C(w, v) — C(u, v, w)
(13)
The drought events were extracted by the three-dimensional drought
identification method (Lloyd-Hughes, 2012). Consequently, 108, 108, and 94 drought events were detected in historical, SSP126, and SSP585
The corresponding joint probabilities and return periods have been
commonly used as important tools for risk assessments of water resource infrastructure designation, construction, and management (Yu et al.,
scenarios, respectively. Fig. 4 shows meteorological drought character- istics under different scenarios. Specifically, when compared with his- torical drought events, droughts intensified under SSP126 in the future.
![]()
![]()

Fig. 2. Taylor diagrams show correlation coefficient, standard deviation, and unbiased root mean square differences of observed and simulated precipitation in 8 CMIP6 models and their average (8ME). (a) uncorrected and (b) bias-corrected.
![]()
![]()
![]()

Fig. 3. Spatiotemporal characteristics of precipitation. (a) variations of annual precipitation for different climatic scenarios (shadow areas represent the range of scenarios in 8 bias-corrected CMIP6 models); (b) spatial distributions of variation rates between historical (1971–2010) and SSP126 (2061–2100) scenario, and (c) spatial distributions of variation rates between SSP126 (2061–2100) and SSP585 (2061–2100) scenario.

Mean
Median
Fig. 4. Meteorological drought characteristics for different scenarios: (a) duration, (b) severity, and (c) affected area for the historical periods and future projections (SSP 126 and 585).
![]()
![]()
![]()
![]() For example, comparing with the historical scenario, the average drought duration increased from 4.52 months to 4.90 months and drought severity increased from 4.68 106 month km2 to 5.13 106
For example, comparing with the historical scenario, the average drought duration increased from 4.52 months to 4.90 months and drought severity increased from 4.68 106 month km2 to 5.13 106
![]() month km2. However, a slight decrease (2.3%) was shown in the mean
month km2. However, a slight decrease (2.3%) was shown in the mean
![]() affected areas under SSP126 scenario. Although the number of drought events decreased slightly under the SSP585 scenario, the average duration (5.16 months), severity (6.38 106 month km2), and
affected areas under SSP126 scenario. Although the number of drought events decreased slightly under the SSP585 scenario, the average duration (5.16 months), severity (6.38 106 month km2), and
![]() affected area (1.50 106 km2), of drought events were highest among
affected area (1.50 106 km2), of drought events were highest among
the three scenarios.
3.3. Risk analysis of meteorological drought
3.3.1. Marginal distribution functions
Seven possible marginal distributions, including exponential, gamma, log-normal, log-logistic, generalized extreme value, generalized Pareto, and Weibull distributions, were chosen to fit the drought vari- ables by the maximum likelihood estimation (MLE) method. The results of Kolmogorov-Smirnov (K-S) test and the Anderson-Darling (A-D) test were selected as the criteria for evaluating goodness of fit of these dis- tributions. For the historical scenario, the generalized extreme value, log-logistic, and log-normal distributions were finally selected as the
marginal distributions for drought duration, severity, and affected area, respectively.
The Probability-Probability (PP) plot in Fig. 5(a–c) showed that the estimated theoretical cumulative probability fitted the empirical se- quences well, which confirmed that the drought variables could be well- simulated by the selected marginal distributions. Using the same method for the projected scenarios, the generalized extreme value distribution was confirmed to be the best fitting marginal distribution for all three drought characteristics.
3.3.2. Copula models
Table 2 lists the results of Pearson correlation of D-S, D-A, and S-A, implying that they are significantly related (p < 0.05). In particular, the correlation coefficients of S-A were 0.93, 0.96 and 0.96 under the his-
torical, SSP126 and SSP585 scenarios, respectively. The variables were more strongly correlated under future emission scenarios than under the historical scenario. The strong relationship of drought variables indi- cated that it would be effective and meaningful to build a multivariate model for probabilistic quantification of droughts by connecting mar- ginal distributions through copula (Nelsen, 1998). The occurrence of severe meteorological drought was usually accompanied by a longer
![]()
![]()
![]()

Fig. 5. Probability-Probability (PP) plot of the marginal and joint probabilities in historical periods. (a) duration, (b) severity, (c) affected area, (d) duration-severity,
(e) duration-affected area, (f) severity-affected area, and (g) duration-severity-affected area.
![]()
![]() GOF test of copulas by AIC.
GOF test of copulas by AIC.
Correlation coefficient AICa Optimal copula
![]()
Gaussian t Clayton Frank Gumbel Joe
![]()
Historical D-S 0.68 -71.22 -73.75 – -70.13 -71.31 -54.84 t
D-A 0.49 -71.21 -69.21 – -73.63 -65.28 -47.87 Frank
S-A 0.93 -50.11 -50.29 -30.15 -47.75 -57.12 -56.64 Gumbel
D-S-A – -149.44 -152.68 -129.80 -174.54 -170.94 -139.41 Frank
SSP126 D-S 0.85 -128.80 -126.80 – -152.87 -132.26 -112.48 Frank
D-A 0.80 -142.75 -141.29 – -139.21 -147.43 -127.81 Gumbel
S-A 0.96 -131.05 -129.26 -88.92 -128.56 -129.30 -115.14 Gaussian
D-S-A – -295.10 -294.61 -202.72 -325.34 -314.71 -273.40 Frank
SSP585 D-S 0.84 -109.83 -110.10 – -107.03 -116.83 -102.87 Gumbel
D-A 0.79 -123.82 -123.92 – -120.30 -130.44 -114.33 Gumbel
S-A 0.96 -102.28 -106.22 -63.62 -105.76 -120.05 -120.67 Joe
![]()
D-S-A – -247.46 -258.07 -202.00 -264.57 -289.65 -261.62 Gumbel
a The smallest AIC in the row was highlighted in bold.
![]()
![]()
duration and extended affected area, indicating that there was a po- tential connection between these three drought characteristics (Chen et al., 2019).
The multivariate Gaussian, t, Clayton, Gumbel, Frank, and Joe copula functions were chosen as candidate copulas and the parameters were estimated by the MLE method. Table 2 shows the results of the GOF tests of the copula functions by the Akaike information criterion (AIC) (Akaike, 1974), for which the preferred model should be the one with the smallest AIC value. For the bivariate copulas, the t, Frank, and Gumbel copulas were selected for the D-S, D-A, and S-A, respectively, under the historical scenario. The Frank, Gumbel, and Gaussian copulas
were selected for the D-S, D-A and S-A, respectively, under the SSP126 scenario. Based on the estimated distribution and parameters, compar- ison of theoretical and empirical probabilities of D-S, D-A, and S-A were obtained and shown in Fig. 5(d–f). The points were aligned along the diagonal in Fig. 5(d–f), which indicated a good consistency between the theoretical and empirical cumulative distributions for drought proper- ties. For the SSP585 scenario, the Gumbel copula was chosen to match D-S and D-A while the Joe copula was used to fit S-A. For the trivariate copulas, the Frank, Frank, and Gumbel copulas were selected for the D-S-A in historical, SSP126, and SSP585 scenarios, respectively.
![]()
![]()
![]()
3.3.3. Return periods analysis
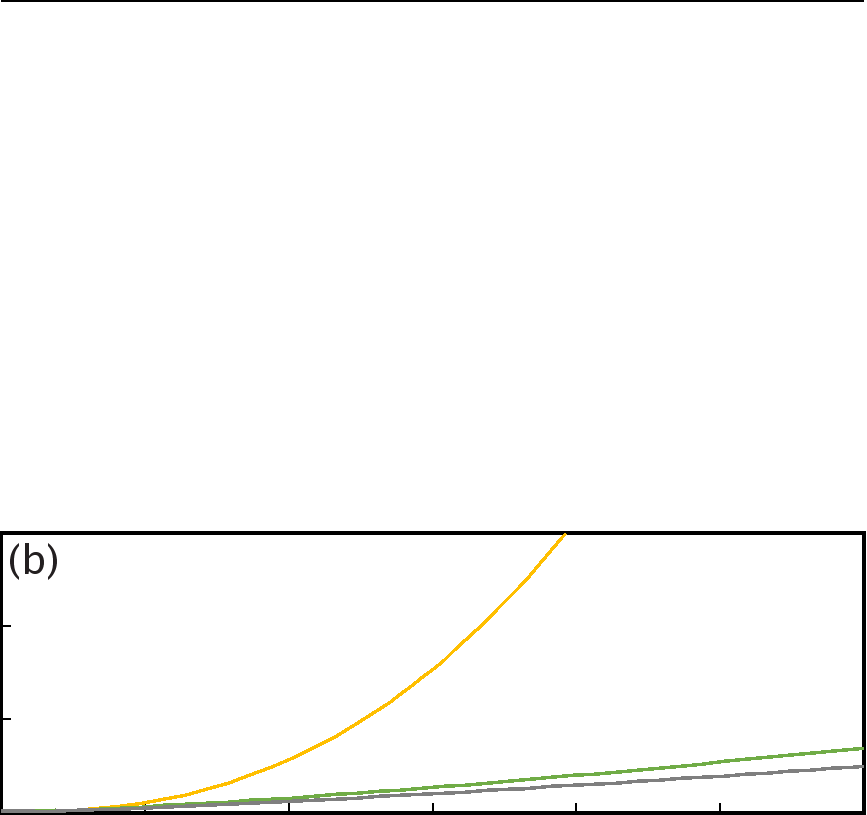
Based on fitted marginal distribution function and copula function, univariate, bivariate, and trivariate joint distributions of meteorological drought characteristics under different scenarios were established in this study. The variation of univariate return periods of the drought dura- tion, severity, and affected area in Fig. 6 showed that the risk of drought was higher in the projected scenarios than that in the historical. For
example, when the droughts duration, severity, and affected area were
![]() 12.6 month, 2.2 107 month km2, and 5.0 106 km2, the univariate return periods were 20 years in the historical scenario. The return pe- riods of droughts duration, severity, and affected area in the SSP126 (SSP585) scenario reduced by 50.4% (46.5%), 78.8% (23.9%), and 69.4% (34.3%) with respect to that of the historical period respectively. This result indicated that the risk of extreme droughts increased in the CMIP6 projected scenarios. The difference in these results between SSP126 and SSP585 scenarios may cause by the difference in carbon emission models. Specifically, the SSP126 scenario is a sustainable development model with low carbon emissions and the SSP585 scenario is a fossil-fueled development forcing scenarios model with high carbon emissions.
12.6 month, 2.2 107 month km2, and 5.0 106 km2, the univariate return periods were 20 years in the historical scenario. The return pe- riods of droughts duration, severity, and affected area in the SSP126 (SSP585) scenario reduced by 50.4% (46.5%), 78.8% (23.9%), and 69.4% (34.3%) with respect to that of the historical period respectively. This result indicated that the risk of extreme droughts increased in the CMIP6 projected scenarios. The difference in these results between SSP126 and SSP585 scenarios may cause by the difference in carbon emission models. Specifically, the SSP126 scenario is a sustainable development model with low carbon emissions and the SSP585 scenario is a fossil-fueled development forcing scenarios model with high carbon emissions.
The bivariate and trivariate return periods for drought characteris- tics were classified as the “and” and “or” conditions. The univariate return period (T) was always longer than the multivariate “or” return
period (Tor) and was lower than the multivariate “and” return period (Tand) (Ma et al., 2013). For example, when T = 20 for the individual property, TDorA and TSorA shortened to 12.2 and 10.5 years, respectively,
while TDandA and TSandA elongated to 213.2 and 37.8 years. For trivariate return periods, TDorSorA was only 7.3 years and TDandSandA increased to 1141.9 years when T was 20 years. The use of multivariate models could estimate the possibility of drought events from multiple drought aspects and provided useful estimations for possible socio-economic losses.
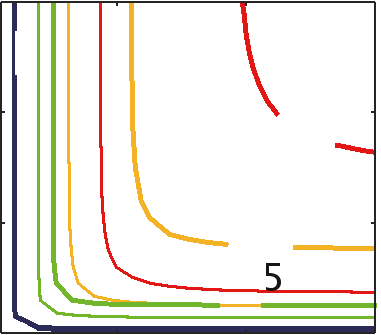
The results showed in Fig. 7 demonstrated the changes of bivariate “or” return periods in different scenarios. With increased values of drought characteristics, Tor was always shorter than that of the historical

![]() 100
100
50
0
0 5 10 15 20 25
Duration (month)
 150
150
![]() 100
100
50
0
0 1 2 3 4 5 6
Severity (107 month× km2)
 150
150
![]() 100
100
50
0
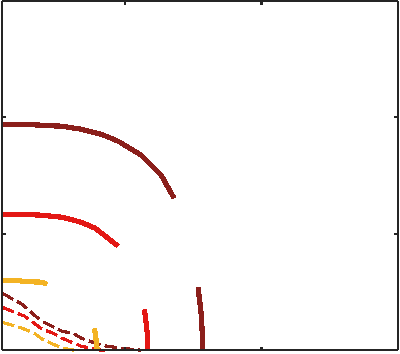
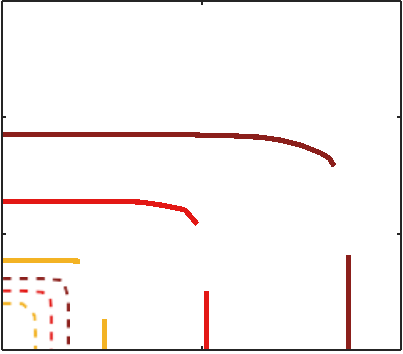
periods. Tor return periods under different scenarios demonstrated that the drought risk was higher in the SSP585 scenario in CMIP6. This phenomenon was more obvious in the comparisons of bivariate “and” return periods. With increased values of different drought characteris- tics in Fig. 8, the drought return periods in future scenarios were also clearly lower than that in the historical period, especially in the SSP585 scenario. For example, when the historical “or” return period of affected area and severity was 100 years, the future return period was less than 20 years (Fig. 8(c) and (f)). This showed that meteorological drought would become more frequent in the projected scenarios than that in the historical period.
For trivariate case (Fig. 9), the return period was much smaller than that for the historical scenario. For instance, the historical “or” and “and” return periods were 3.5 and 241.2 years, when the duration,
severity and affected area were 8.5 month, 2 × 10⁷ month × km2, 3 × 10⁶ km2, respectively. However, for projected SSP126 and SSP585
scenarios, the “or” return period decreased to 2.8 and 2.6 years and the “and” return period decreased to 25.3 and 7.2 years, respectively. These results indicated that extreme meteorological drought events with long durations, high severities, and extended affected areas were more likely to occur with high probability in China in the future.
3.4. Case studies of extreme drought events
The top five most severe drought events ranked by drought severity were listed in Table 3. During the historical period, the most severe meteorological drought occurred from November 1999 to April 2000, which was also characterized by the second largest affected area (around 46.04% of the study area). These results were consistent with the persistent drought disasters in northern China, which were recorded by the China Meteorological Administration (CMA) near 2000. Among the top five most severe droughts in the historical period, four events were detected during 1996–2002, which were consistent with the study of Wang et al. (2011) based on soil moisture drought.
The “and” return periods of the top five most severe meteorological drought events under the historical scenario were displayed in Fig. 10, which also showed comparisons of return period of these same drought events under the SSP126 and SSP585 scenarios. Considering univariate drought characteristics, the return periods of drought duration, severity, and affected area were 4.4, 34.2, and 24.5 years, respectively (Fig. 10 (a)). However, the return periods for duration, severity, and affected area decreased to 3.3, 8.6, and 10.7 years in the SSP126 scenario and to 2.9, 6.6, and 7.3 years in SSP585 scenario, respectively. When comes to multivariate characteristics, under the historical scenario, the “and” return period increased to 45.1 (D-S), 67.5 (D-A), 55.9 (S-A), and 688.3 (D-S-A) years. For the future emission scenarios, 14.6 (D-S), 11.1 (D-A),
18.6 (S-A), and 42.3 (D-S-A) years were determined for the SSP126 scenario and 7.4 (D-S), 7.6 (D-A), 9.1 (S-A), and 9.6 (D-S-A) years were determined for the SSP585 scenario. The results showed in Fig. 10 indicated that both the univariate and multivariate return periods ten- ded to be shorter in SSP126 scenario. However, the return period for the longest duration tended to be longer in the future period under the SSP126 scenario (Fig. 10(c)), which indicated that the risk of extremely long duration drought was relatively low.
The “and” return periods decreased greatly in SSP585 scenario. These results suggested that similar extreme meteorological droughts in the historical period would appear more frequently in the future period. The return period under the SSP585 scenario was also much shorter than that of SSP126, especially when droughts were prolonged.
![]()
0 2 4
Affected area (106
6 8
km2)
4.1.
Comparison with other studies
Fig. 6. Marginal distributions of drought characteristics for different scenarios (historical, SSP126, SSP585). (a) duration, (b) severity, and (c) affected area.
In this study, we selected the latest climate projection data from the CMIP6 model simulations. Overall, results of this study were consistent

![]() 1
1
0
0 20 40
2
![]() 1
1
0
60 0
 20 40
20 40
2
![]() 1
1
0
60 0
T=1 T=5
![]()
![]()
![]() 1 2
1 2
 Duration (month)
![]()
![]()
 2 (d)
2 (d)
Duration (month)
![]()
![]()
 3 (e)
3 (e)
Severity (108 month× km2)
![]()
![]()
![]()
 3 (f)
3 (f)
T=20 T=50
![]() 1
1
0
0 20 40
2
![]()
![]() 1
1
0
60 0
20 40
2
![]()
![]()
![]() 1
1
0
60 0 1 2
Duration (month)
Duration (month)
Severity (108 month× km2)
Fig. 7. Contours of bivariate “or” return periods (years) of drought characteristics in historical scenario (dotted line) and projected scenarios (solid line), including SSP 126 (a, b, and c) and SSP585 (d, e, and f).

2
1
![]() 1
1
![]() 0 0
0 0
0 20 40 60 0
2
![]()
![]()
![]() 1
1
0
20 40 60 0
![]()
![]()
![]()

 1 2
1 2
8
![]() T=20 T=50
T=20 T=50
Duration (month)
Duration (month)
Severity (10
month× km2)
![]()
![]()
![]()
![]()
![]()
![]() (d) (e) (f)
(d) (e) (f)
T=100

 2 3 3
2 3 3
2 2
![]()
![]()
![]() 1
1
![]()
![]()
![]()
![]()
![]()
![]() 1 1
1 1
![]()
![]()
0 0
0 20 40 60 0
0
20 40 60 0 1 2
![]()
Duration (month)
Duration (month)
Severity (108 month× km2)
Fig. 8. Contours of bivariate “and” return periods (years) of drought characteristics in historical scenario (dotted line) and projected scenarios (solid line), including SSP 126 (a, b, and c) and SSP585 (d, e, and f).
with those studies based on the CMIP5 model in mainland China, which all showed precipitation and duration/severity of drought events would increase simultaneously under climate change (Leng et al., 2015; Zhang et al., 2019; Yang et al., 2020). This phenomenon has also been iden- tified in the similar area in other parts in Asia (Sharma and Goyal, 2020). However, Xin et al. (2020) confirmed that CMIP6 had better perfor- mance than CMIP5 in simulating precipitation over Eastern China. The East Asian summer monsoon (EASM) is an important factor in influ- encing the relationship between different drought characteristics (Xu et al., 2015). Because the CMIP6 model improving the reproducing capability of the climatological pattern of the EASM (Xin et al., 2020),
CMIP6 model may perform better than CMIP5 model in drought risk assessment. Compared with the CMIP5 model (Moss et al., 2010), the CMIP6 model considered not only the carbon emission path but also the social development factors such as GDP and population, which may provide more reliable estimation of future climate scenarios O’Neill et al. (2016); Zelinka et al. (2020). This will aid the evaluation of drought characteristics affected by climate change and human activities for the mitigation efforts under global warming. In addition, for the multivariate analysis of drought, previous studies mainly established the two-dimensional model for evaluating characteristics of drought, which mostly considered the combined effect of drought duration and severity
![]()
![]()

Fig. 9. Trivariate “or” return periods (a, b, and c) and “and” return periods (d, e, and f) of meteorological drought in different scenarios.
The top five most severe drought events ranked by drought severity.
![]()
![]() Duration (D) (month) Duration rank Severity (S) (107 month×km2 × month) Severity rank Affected area (A) ( 106 km2) Area rank 7 (1999.10–2000.4) 9 2.16 1 4.42 2
Duration (D) (month) Duration rank Severity (S) (107 month×km2 × month) Severity rank Affected area (A) ( 106 km2) Area rank 7 (1999.10–2000.4) 9 2.16 1 4.42 2
8 (2002.4–2002.11) 5 1.82 2 4.05 3
12 (1998.1–1999.0) 1 1.74 3 2.43 12
6 (1985.1–1985.6) 15 1.56 4 4.79 1
![]()
6 (1996.3–1996.8) 15 1.48 5 3.49 5
![]()
![]()
![]()
in a fixed area (Ge et al., 2016; Ahn and Palmer, 2016; Dai et al., 2020). The three-dimensional method in our study provides a possibility to establish a framework of risk assessment for multiple elements, which could provide policymakers comprehensive evaluations of drought risks in the future (Lloyd-Hughes, 2012; Liu et al., 2019; Zhu et al., 2019).
4.2. Implication for drought management under global warming
Facing with the rapid changes of environment caused by the accu- mulation of greenhouse gases in the atmosphere, the changes of drought have become a critical challenge of risk assessment and management. Our results could further be applied for policy making at various phys- ical, socioeconomic, and environmental aspects related to drought. Different carbon emission scenarios have been shown to have various effects on drought events (Sheffield and Wood, 2008; Orlowsky and
Seneviratne, 2013; Zhin˜a et al., 2019). Therefore, how to improve the drought management under the changing environment is crucial for water resource management, agricultural management, and ecological restoration. The increasing drought risk in future would largely affect different sectors of the society of China, especially the primary industry, which is the fundamental of national welfare of the residents (Li et al., 2020). To mitigate this negative effect of drought, several measurements should be considered, such as the shifting of agricultural areas, adjust- ment of planting structure, and improvement of water-saving irrigation and cultivation techniques, as potential mitigation measures (Tankari et al., 2020; Mphande et al., 2020). In order to accurately assess the vulnerability of drought event for the vulnerable regions, the drought evaluation framework proposed in this study would be useful for taking the drought area, duration and severity into consideration.
![]()
![]()
![]()

Fig. 10. Return periods of the top five most severe historical meteorological drought events and relative return periods when they occurred in the SSP126 and SSP585 models.
![]()
![]()
![]()
4.3. Limitation
In our study, the downscaling and bias corrections methods in Sec- tion 2.2 have been shown to reduce biases in the model simulations. However, due to the data limitation, we only corrected simulations from 8 CMIP6 models for both periods. In further research, we will focus on downscaling a larger set of CMIP6 models to estimate changes of cli- matic and extreme weather in the future. The present downscale methods did not consider the effect of land use and topography, which may cause uncertainties to historical and future precipitation. Future changes in climate factors (such as temperature rise, precipitation changes) are expected to have large uncertainties, and there are large differences between different GCMs (Schewe et al., 2014). Dynamical downscaling approaches could be used for further studies of CMIP6 projections for multivariate drought assessment in China (Chen et al., 2013; Fang et al., 2015). This study mainly addressed future drought events at national scales without consideration of the regional charac- teristics. For example, the area threshold for identifying drought at na- tional scales would not be applicable for the regional studies.
This study investigated variations in multiple drought characteristics between the historical and projected periods of CMIP6 (SSP126 and SSP585) in China. First, the EDCDF method was used for bias corrections for the CMIP6 model outputs over China. The spatial resolution and accuracy of the projected data were greatly improved. To determine the variations for each scenario, the duration, severity, and affected area were selected to identify the drought characteristics. The differences between the historical (1971–2010) and future (2061–2100) scenarios
for the different properties of meteorological drought in China were analyzed through three-dimensional identification methods. Then, both univariate and multivariate probability distributions were constructed to analyze the risk (or return periods) of drought properties. The results of this study may provide useful insights for improving risk management of drought under global warming. The conclusions were as follows:
(1) Based on corrected CMIP6 simulations, the precipitation char- acteristics in China would change substantially both spatially and temporally in the future. In particular, the annual average pre- cipitation could increase by 12.0% and 19.5% for the SSP126 and SSP585 scenarios, respectively. Spatially, the arid area in north- western China would receive more precipitation under both the SSP126 and SSP585 scenarios. The Qinghai–Tibet Plateau would receive more rainfall while less precipitation would occur in the Sichuan Basin under the SSP585 scenario than that under the SSP126 scenario.
(2) The duration, severity, and affected area of meteorological drought would intensify under the CMIP6 projected scenarios, especially in the SSP585 scenario. Based on the comparison be- tween the historical period and projected SSP126 and SSP585 scenarios, the average duration increased from 4.52 months to
![]()
![]() 4.90 and 5.16 months, respectively, and the severity increased from 4.68 106 month km2 to 5.13 106 and 6.38 106 month km2. Notably, the mean affected area decreased by 2.3%
4.90 and 5.16 months, respectively, and the severity increased from 4.68 106 month km2 to 5.13 106 and 6.38 106 month km2. Notably, the mean affected area decreased by 2.3%
in SSP126 while increased by 17% in SSP585.
(3) Both the “or” and “and” return periods decreased in the future, which might indicate the increased risk for meteorological drought. The return period under the SSP585 scenario was less than that under the SSP126 scenario. Meteorological drought
![]()
![]()
![]()
events with long duration, high severity and extended affected areas were more likely to occur at the same time.
(4) For the severe drought event in historical periods, the return periods of drought duration, severity, and affected area were 4.4, 34.2, and 24.5 years, which decreased to 3.3, 8.6, and 10.7 years in SSP126 and to 2.9, 6.6, and 7.3 in SSP585, respectively. The multivariate “and” return periods also decreased in the SSP126 and SSP585 scenarios.
Declaration of Competing Interest
The authors declare that they have no known competing financial interests or personal relationships that could have appeared to influence the work reported in this paper.
This work is supported by the “National Natural Science Foundation of China” (NSFC, No. 41907157), “China”; “National Key Research and Development Program of China” (2018YFC1508901), “China”, and "the 111 Project" (B18006), "China".
Abro, M.I., Wei, M., Zhu, D., Elahi, E., Ali, G., Khaskheli, M.A., Shah, A.R., Nkunzimana, A., 2020a. Hydrological evaluation of satellite and reanalysis precipitation products in the glacier-fed river basin (Gilgit). Arab. J. Geosci. 13 (14), 97.
Abro, M.I., Zhu, D., Ali Khaskheli, M., Elahi, E., Aleem ul Hassan Ramay, M., 2020b. Statistical and qualitative evaluation of multi-sources for hydrological suitability inflood-prone areas of Pakistan. J. Hydrol. 588, 125117.
Ahn, K.-H., Palmer, R.N., 2016. Use of a nonstationary copula to predict future bivariate low flow frequency in the Connecticut river basin. Hydrol. Process. 30 (19), 3518–3532.
Akaike, H., 1974. A new look at the statistical model identification. IEEE Trans. Automat.
Andreadis, K.M., Clark, E.A., Wood, A.W., Hamlet, A.F., Lettenmeaier, D.P., 2005.
Twentieth-century drought in the conterminous United States. J. Hydrometeorol. 6, 985–1001.
Ayantobo, O.O., Li, Y., Song, S., Javed, T., Yao, N., 2018. Probabilistic modelling of drought events in China via 2-dimensional joint copula. J. Hydrol. 559, 373–391.
Chen, J., Brissette, F.P., Chaumont, D., Braun, M., 2013. Finding appropriate bias correction methods in downscaling precipitation for hydrologic impact studies over North America. Water Resour. Res. 49 (7), 4187–4205.
Chen, L., Singh, V.P., Guo, S., Zhou, J., Zhang, J., 2015. Copula-based method for multisite monthly and daily streamflow simulation. J. Hydrol. 528, 369–384.
Chen, X., Li, F., Li, J., Feng, P., 2019. Three-dimensional identification of hydrological drought and multivariate drought risk probability assessment in the Luanhe River basin, China. Theor. Appl. Climatol. 137 (3–4), 3055–3076.
Dai, A., Zhao, T., Chen, J., 2018. Climate change and drought: a precipitation and evaporation perspective. Curr. Clim. Change Rep. 4 (3), 301–312.
Dai, M., Huang, S., Huang, Q., Leng, G., Guo, Y., Wang, L., Fang, W., Li, P., Zheng, X., 2020. Assessing agricultural drought risk and its dynamic evolution characteristics. Agric. Water Manag. 231, 106003.
Das, J., Jha, S., Goyal, M.K., 2020. Non-stationary and copula-based approach to assess the drought characteristics encompassing climate indices over the Himalayan states in India. J. Hydrol. 580, 124356.
Diaz, V., Corzo Perez, G.A., van Lanen, H.A.J., Solomatine, D., Varouchakis, E.A., 2020. Characterisation of the dynamics of past droughts. Sci. Total Environ. 718, 134588.
Eyring, V., Bony, S., Meehl, G.A., Senior, C.A., Stevens, B., Stouffer, R.J., Taylor, K.E., 2016. Overview of the Coupled Model Intercomparison Project Phase 6 (CMIP6) experimental design and organization. Geosci. Model Dev. 9 (5), 1937–1958.
Fang, G.H., Yang, J., Chen, Y.N., Zammit, C., 2015. Comparing bias correction methods in downscaling meteorological variables for a hydrologic impact study in an arid area in China. Hydrol. Earth Syst. Sci. 19 (6), 2547–2559.
FAO, 2018. The Impact of Disasters and Crises on Agriculture and Food Security 2017.
Food and Agriculture Organization of the United Nations, Rome.
Fowler, H.J., Blenkinsop, S., Tebaldi, C., 2007. Linking climate change modelling to impacts studies: recent advances in downscaling techniques for hydrological modelling. Int. J. Climatol. 27 (12), 1547–1578.
Ge, Y., Cai, X., Zhu, T., Ringler, C., 2016. Drought frequency change: an assessment in northern India plains. Agric. Water Manag. 176, 111–121.
Grillakis, M.G., 2019. Increase in severe and extreme soil moisture droughts for Europe under climate change. Sci. Total Environ. 660, 1245–1255.
Han, Z., Huang, Q., Huang, S., Leng, G., Bai, Q., Liang, H., Wang, L., Zhao, J., Fang, W., 2021. Spatial-temporal dynamics of agricultural drought in the Loess Plateau under a changing environment: characteristics and potential influencing factors. Agric.
Hao, Z., AghaKouchak, A., 2013. Multivariate standardized drought index: a parametric multi-index model. Adv. Water Res. 57, 12–18.
Hao, Z., Hao, F., Singh, V.P., Ouyang, W., Cheng, H., 2017. An integrated package for drought monitoring, prediction and analysis to aid drought modeling and assessment. Environ. Modell. Softw. 91, 199–209.
Janga Reddy, M., Ganguli, P., 2012. Application of copulas for derivation of drought severity-duration-frequency curves. Hydrol. Process. 26 (11), 1672–1685.
Jha, S., Das, J., Sharma, A., Hazra, B., Goyal, M.K., 2019. Probabilistic evaluation of vegetation drought likelihood and its implications to resilience across India. Global Planet. Change 176, 23–35.
Leng, G., Tang, Q., Rayburg, S., 2015. Climate change impacts on meteorological, agricultural and hydrological droughts in China. Global Planet. Change 126, 23–34.
Li, H., Sheffield, J., Wood, E.F., 2010. Bias correction of monthly precipitation and temperature fields from Intergovernmental Panel on Climate Change AR4 models using equidistant quantile matching. J. Geophys. Res. 115 (D10), 1645.
Li, J., Wang, Z., Lai, C., 2020. Severe drought events inducing large decrease of net primary productivity in mainland China during 1982–2015. Sci. Total. Environ. 703, 135541.
Liu, Y., Zhu, Y., Ren, L., Singh, V.P., Yong, B., Jiang, S., Yuan, F., Yang, X., 2019.
Understanding the spatiotemporal links between meteorological and hydrological droughts from a three-dimensional perspective. J. Geophys. Res. Atmos. 124 (6), 3090–3109.
Lloyd-Hughes, B., 2012. A spatio-temporal structure-based approach to drought characterisation. Int. J. Climatol. 32 (3), 406–418.
Ma, M., Song, S., Ren, L., Jiang, S., Song, J., 2013. Multivariate drought characteristics using trivariate Gaussian and Student t copulas. Hydrol. Process. 27 (8), 1175–1190.
McKee, T., Doesken, N., Kleist, J., 1993. The relationship of drought frequency and duration to time scales. paper presented at 8th Conference on Applied Climatology, Am. Meteorol. Soc., Anaheim, CA.
Mishra, A.K., Singh, V.P., 2010. A review of drought concepts. J. Hydrol. 391, 202–216. Mishra, A.K., Singh, V.P., 2011. Drought modeling – a review. J. Hydrol. 403 (1–2),
Mishra, A.K., Singh, V.P., Desai, V.R., 2009. Drought characterization: a probabilistic approach. Stoch. Environ. Res. Risk Assess. 23 (1), 41–55.
Moss, R.H., Edmonds, J.A., Hibbard, K.A., Manning, M.R., Rose, S.K., van Vuuren, D.P.,
Carter, T.R., Emori, S., Kainuma, M., Kram, T., Meehl, G.A., Mitchell, J.F.B., Nakicenovic, N., Riahi, K., Smith, S.J., Stouffer, R.J., Thomson, A.M., Weyant, J.P., Wilbanks, T.J., 2010. The next generation of scenarios for climate change research and assessment. Nature 463 (7282), 747–756.
Mphande, W., Kettlewell, P.S., Grove, I.G., Farrell, A.D., 2020. The potential of antitranspirants in drought management of arable crops: a review. Agric. Water Manag. 236, 106143.
Na, Y., Fu, Q., Kodama, C., 2020. Precipitation probability and its future changes from a global cloud-resolving model and CMIP6 Simulations. J. Geophys. Res. Atmos. 125 (5), 228.
Nelsen, R.B., 1998. An Introduction to Copula. Springer, New York.
O’Neill, B.C., Tebaldi, C., van Vuuren, D.P., Eyring, V., Friedlingstein, P., Hurtt, G., Knutti, R., Kriegler, E., Lamarque, J.-F., Lowe, J., Meehl, G.A., Moss, R., Riahi, K., Sanderson, B.M., 2016. The scenario model intercomparison project (ScenarioMIP) for CMIP6. Geosci. Model Dev 9 (9), 3461–3482.
Orlowsky, B., Seneviratne, S.I., 2013. Elusive drought: uncertainty in observed trends and short- and long-term CMIP5 projections. Hydrol. Earth Syst. Sci. 17 (5), 1765–1781.
Quiring, S.M., 2009. Monitoring drought: An evaluation of meteorological drought indices. Geogr. Compass 3 (1), 64–88.
Saghafian, B., Mehdikhani, H., 2014. Drought characterization using a new copula-based trivariate approach. Nat. Hazards 72 (3), 1391–1407.
Schewe, J., Heinke, J., Gerten, D., Haddeland, I., Arnell, N.W., Clark, D.B., Dankers, R., Eisner, S., Fekete, B.M., Colo´n-Gonza´lez, F.J., Gosling, S.N., Kim, H., Liu, X.,
Masaki, Y., Portmann, F.T., Satoh, Y., Stacke, T., Tang, Q., Wada, Y., Wisser, D., Albrecht, T., Frieler, K., Piontek, F., Warszawski, L., Kabat, P., 2014. Multimodel assessment of water scarcity under climate change. PNAS 111 (9), 3245–3250.
Schwalm, C.R., Anderegg William, R.L., Michalak, A.M., Fisher, J.B., Biondi, F., Koch, G., Litvak, M., Ogle, K., Shaw, J.D., Wolf, A., Huntzinger, D.N., Schaefer, K., Cook, R., Wei, Y., Fang, Y., Hayes, D., Huang, M., Jain, A., Tian, H., 2017. Global patterns of drought recovery. Nature 548 (7666), 202–205.
Sharma, A., Goyal, M.K., 2020. Assessment of drought trend and variability in India using wavelet transform. Hydrol. Sci. J. 65 (9), 1539–1554.
Sheffield, J., Wood, E.F., 2008. Projected changes in drought occurrence under future global warming from multi-model, multi-scenario, IPCC AR4 simulations. Clim. Dyn. 31 (1), 79–105.
Shiau, J.T., 2006. Fitting drought duration and severity with two-dimensional copulas.
Water Resour. Manag. 20 (5), 795–815.
Shiau, J.T., Modarres, R., 2009. Copula-based drought severity-duration-frequency analysis in Iran. Met. Appl 16 (4), 481–489.
Sklar, A., 1959. Fonctions de r´epartition `a n dimensions et leurs marges. Publ. Inst. Stat.
Song, S., Singh, V.P., 2010. Meta-elliptical copulas for drought frequency analysis of periodic hydrologic data. Stoch. Environ. Res. Risk Assess. 24 (3), 425–444.
Su, B., Huang, J., Fischer, T., Wang, Y., Kundzewicz, Z.W., Zhai, J., Sun, H., Wang, A.,
Zeng, X., Wang, G., Tao, H., Gemmer, M., Li, X., Jiang, T., 2018. Drought losses in China might double between the 1.5 ◦C and 2.0 ◦C warming. Proc. Natl. Acad. Sci.
Tankari, M., Wang, C., Ma, H., Li, X., Li, L., Soothar, R.K., Cui, N., Zaman-Allah, M., Hao, W., Liu, F., Wang, Y., 2020. Drought priming improved water status,
![]()
![]()
![]()
photosynthesis and water productivity of cowpea during post-anthesis drought stress. Agric. Water Manag., 106565
Taylor, K.E., 2001. Summarizing multiple aspects of model performance in a single diagram. J. Geophys. Res. 106 (D7), 7183–7192.
Wang, A., Lettenmaier, D.P., Sheffield, J., 2011. Soil moisture drought in China, 1950–2006. J. Clim. 24 (13), 3257–3271.
Wilby, R.L., Troni, J., Biot, Y., Tedd, L., Hewitson, B.C., Smith, D.M., Sutton, R.T., 2009. A review of climate risk information for adaptation and development planning. Int. J. Climatol. 29 (9), 1193–1215.
Xiao, M., Yu, Z., Zhu, Y., 2019. Copula-based frequency analysis of drought with identified characteristics in space and time: a case study in Huai River basin, China. Theor. Appl. Climatol. 137 (3–4), 2865–2875.
Xin, X., Wu, T., Zhang, J., Yao, J., Fang, Y., 2020. Comparison of CMIP6 and CMIP5 simulations of precipitation in China and the East Asian summer monsoon. Int. J. Climatol. 22, 472.
Xu, K., Yang, D., Yang, H., Li, Z., Qin, Y., Shen, Y., 2015. Spatio-temporal variation of drought in China during 1961–2012: a climatic perspective. J. Hydrol. 526, 253–264.
Yang, X., Yu, X., Wang, Y., Liu, Y., Zhang, M., Ren, L., Yuan, F., Jiang, S., 2019.
Estimating the response of hydrological regimes to future projections of precipitation and temperature over the upper Yangtze River. Atmos. Res. 104627 (230).
Yang, X., Zhang, L., Wang, Y., Singh, P., Xu, V., Ren, C.-Y., Zhang, L., Liu, M., Jiang, Y., Yuan, F, S., 2020. Spatial and temporal characterization of drought events in China using the Severity-Area-Duration method. Water 12, 230.
Yevjevich, V., 1967. An Objective Approach to Definitions and Investigations of Continental Hydrologic Drought. Colorado State Univ., Fort Collins (Colo. Accessed).
Yu, J., Choi, S.-J., Kwon, H.-H., Kim, T.-W., 2018. Assessment of regional drought risk under climate change using bivariate frequency analysis. Stoch. Environ. Res. Risk Assess. 32 (12), 3439–3453.
Zhang, J., Sun, F., Lai, W., Lim, W.H., Liu, W., Wang, T., Wang, P., 2019. Attributing changes in future extreme droughts based on PDSI in China. J. Hydrol. 573, 607–615.
Zelinka, M.D., Myers, T.A., McCoy, D.T., Po-Chedley, S., Caldwell, P.M., Ceppi, P., Klein, S.A., Taylor, K.E., 2020. Causes of higher climate sensitivity in CMIP6 models. Geophys. Res. Lett. 47, e2019GL085782.
Zhang, L., Singh, V.P., 2006. Bivariate flood frequency analysis using the copula method.
J. Hydrol. Eng. 11 (2), 150–164.
Zhao, T., Dai, A., 2017. Uncertainties in historical changes and future projections of drought. Part II: model-simulated historical and future drought changes. Clim. Change 144 (3), 535–548.
Zhin˜a, D., Montenegro, M., Montalv´an, L., Mendoza, D., Contreras, J., Campozano, L.,
Avil´es, A., 2019. Climate change influences of temporal and spatial drought variation in the Andean high mountain basin. Atmosphere 10 (9), 558.
Zhu, D., Wang, G., Ren, Q., Ilyas, A.M., 2020. Hydrological evaluation of hourly merged satellite–station precipitation product in the mountainous basin of China using a distributed hydrological model. Meteorol. Appl. 27 (2), 146.
Zhu, Y., Liu, Y., Wang, W., Singh, V.P., Ma, X., Yu, Z., 2019. Three dimensional characterization of meteorological and hydrological droughts and their probabilistic links. J. Hydrol. 578, 124016.
![]()