
利用覆盖滴灌提高玉米产量,减少土壤中的氮残留

![]()

 Agricultural Water Management 251 (2021) 106871
![]()
Improving maize production and decreasing nitrogen residue in soil using ![]() mulched drip fertigation
mulched drip fertigation
Dan Wang a, b, Yan Mo c, Guangyong Li b,*, Carol Jo Wilkerson d, Gerrit Hoogenboom e, f
a College of Water Resources Science and Engineering, Taiyuan University of Technology, Taiyuan 030024, China
b College of Water Resources & Civil Engineering, China Agriculture University, Beijing 100083, China
c Department of Irrigation and Drainage, China Institute of Water Resources and Hydropower Research, Beijing 100091, China
d Independent Scholar, Gainesville, FL 32614, United States
e Agricultural and Biological Engineering Department, University of Florida, Gainesville, FL 32611, United States
f Institute for Sustainable Food Systems, University of Florida, Gainesville, FL 32611, United States
![]()
A R T I C L E I N F O
![]() Handling Editor: Dr Z. Xiying
Handling Editor: Dr Z. Xiying
![]() Keywords:
Keywords:
Maize
Water use efficiency N recovery efficiency Soil N residue
Mulched drip fertigation N accumulation
A B S T R A C T
![]()
Nitrogen (N) application is important for agricultural practical management. The study aimed to determine the impact of N application amount on maize growth, water and N use efficiency, and soil N residue under in-season mulched drip fertigation (M-DF) in semi-arid region with chilling damage. The experiment was carried out in
2015 and 2016 in northeast China, with six N application amounts including 0, 140, 190, 240, 290 and 340 kg⋅ha—1 (referred to N0, N140, N190, N240, N290 and N340). The N application amount of 340 kg⋅ha–1 is widely
applied in local high-yield maize field. Results showed that appropriate application of N fertilizer under M-DF improved maize plant height, stem diameter, and leaf area index to respond positively to grain yield. In-season supply of N through M-DF increased the N accumulation (NA) of plant during maize reproductive stages (from tasseling to maturity), which accounted for 42.7–50.7% of the total NA for the whole growing season across the treatments. The effect of N application amount on the NA of plant was gradually more obvious after maize tasseling, which was mainly reflected in the differences in NA of ears. The NA of ears accounted for 75.3–77.7% of the total NA of plant at maturity across the treatments. The NA and N recovery efficiency of plant, grain yield,
and water use efficiency at maturity obviously increased when the N rate ranged from 0 to 240 kg⋅ha–1; while it
showed a negative effect when the N amount continue to increase. The soil N residue rate in treatments of N290 and N340 were much higher than other treatments, and obviously increased by 10.0–11.8% points the second year. The study suggested a reasonable threshold of 226–253 kg⋅ha–1 of N applied through in-season M-DF for maize with high yield and resources use efficiency but lower soil N residue rate, which decreased by 12.2–16.0% points compared with that under conventional N application amount of 340 kg⋅ha–1 in local field. The conclu- sions can provide scientific basis for maize production in northeast China and other regions with similar climate or productive conditions worldwide.
![]()
Global crop demand is projected to double by 2050 due to an ex- pected rapid increase in the global population (Tilman et al., 2011). Currently, the application of mineral nitrogen (N) is a main pathway to increase crop yield and maintain the soil fertility (Hirel et al., 2011). China has been the top consumer of N fertilizer in order to be able feed more than one fourth of the world’s population on 8% of the global cropland (FAO, 2011; Heffer et al., 2017). There is mounting evidence showing that the N fertilizer application in China has largely surpassed
the crop demands and consequently triggered severe environmental problems (Zhang et al., 2012, 2016; Sun et al., 2018). Therefore, developing efficient fertigation techniques is needed in order to improve the water and fertilizer use efficiency, which in turn will result in sus- tainable development of agriculture and improvement of farmland.
Nitrogen is an essential constituent of protein, nucleic acids, chlo- rophyll and growth hormones in plants, which directly affects the pro- cesses of assimilation and photosynthesis (Barker et al., 1974; Leghari et al., 2016). Nitrogen deficiency may result in stunted seedlings, slow growth and grain wight reduction (Uhart and Andrade, 1995). An
![]()
E-mail address: lgycau@163.com (G. Li).
https://doi.org/10.1016/j.agwat.2021.106871
Received 1 December 2020; Received in revised form 13 March 2021; Accepted 15 March 2021
Available online 25 March 2021
0378-3774/© 2021 Elsevier B.V. All rights reserved.
![]()
![]()
optimum amount of N fertilizer is beneficial to the synthesis of chloro- phyll, which hastens plant growth and the accumulation of biomass (Dordas and Sioulas, 2008). While excessive use of N fertilizer may lead to tip or leaf burn of seedlings (Styer, 2009), excess vegetative growth thus increasing superfluous crop water evapotranspiration and energy consumption (Rudnicka et al., 2017; Wang et al., 2019c), and decrease in fruit quantity with low quality (Leghari et al., 2016). Therefore, appropriate N input and efficient use of N in crop cultivation is critical for optimum crop productivity and the field nutrient management.
Nitrogen fertilizer is converted into nitrate (NO–3–N) and ammonium (NH+4 –N) structure, which are the main forms of N absorbed by plants in
soil (King et al., 1992; Zhang et al., 2016). Currently, only 30–50% of applied N fertilizer is taken up by crops (Tilman et al., 2002). In the most intensive agricultural production systems, more than half of the N used for crop fertilization is lost into the environment (Hirel et al., 2011; Lassaletta et al., 2014; Maresma et al., 2019). Excessive N application rates potentially have a negative impact on the environment and cannot be ignored; it can increase greenhouse gas emissions and can also cause eutrophication resulting in a loss of diversity and degradation of soil and freshwater resources (Vitousek et al., 1997; Cassman, 1999; Tilman et al., 2002; Hirel et al., 2011). Therefore, the scientific N fertilization management is crucial to coordinate the efficient use of resources and farmland environmental protection.
Drip irrigation, as one of the most efficient agricultural technique for water and fertilizer saving, has been widely used in greenhouses, or- chards, and field crops worldwide (Al-Said et al., 2012; Chukalla et al., 2015; Rashidi and Keshavarzpour, 2011; Wu et al., 2021; Yang et al., 2011; Sinha et al., 2017). The development of the Best Management Practices (BMPs) for N use under drip fertigation provides producers a way to remain operationally and economically viable (Lamb et al., 2008; Lamm and Schlegel, 2004; Mpanga and Idowu, 2020). Mulched drip fertigation (M-DF) combines advantages of film mulching and precision placement of water and fertilizer (Li et al., 2016; Zhang et al., 2018; Zou et al., 2020; Ning et al., 2020), which has been developed more than 3.3 million hectare in northwest China where the evaporation is much greater than precipitation (Lin et al., 2019). However, due to the global climate change and the high latitude of the maize belt in northeast China, in which maize yield accounts for 30% of the whole country (Ma et al., 2008), the main problem for maize planting is that the accumu- lative temperature is insufficient, and the water shortage seasonally is unfavorable to maize growth given the uneven precipitation in time and space. In recent years, M-DF was gradually used for maize cultivation in northeast China, numerous studies have been carried out on the effect of film mulching, irrigation regime of M-DF and mechanism of water saving with yield increase (Liu et al., 2014; Sui et al., 2018; Wang et al., 2019a; Zhang et al., 2017). However, these studies followed the tradi- tional field management habits with relatively low fertigation frequency and planting density. There are limited few studies on the quantitative analysis of the synergistic performance of maize growth and N recovery of plant-soil system under different N application rates under M-DF in the northeast China. Based on the high-yield agricultural practices of close planting and in-season fertigation with M-DF technique for maize (Uzbek, 2013; Xu 2014), a number of treatments with smaller in- crements in N application rate are designed to determine the optimum N input.
Understanding the ability of maize to use water and N resources efficiently is of crucial importance for decisions related to the best management practice of N through drip fertigation. Therefore, the ob- jectives of this study were to evaluate maize growth and N uptake under different N application amounts, and to identify the peak demand for N of maize, and to develop a reasonable input threshold of N fertilizer for M-DF based on grain yield, water and N use efficiency, and N residue in the soil.
2.1. Experimental site and design
The experiments were conducted in 2015 and 2016 in Chifeng in
Inner Mongolia, China (42◦56’53"N, 119◦4′20"E). The area has a semi- arid and continental monsoon climate with an average frost-free
period of 135 days. Annual average precipitation ranges from 350 to 450 mm and average total evaporation ranges from 1500 to 2300 mm. The previous crop in the field is maize with unified management for more than three years. Before the first sowing season of the experiment, the field was rotated twice to make it flat and have uniform initial fertility. The soil at 0–60 cm depth, which was the main distribution layer of maize root (Li et al., 2017; Zhou et al., 2017; Xu, 2014), is silt
loam with an average soil bulk density of 1.49 g⋅cm—3. The soil nutrient
contents were 10.6 g⋅kg—1 for organic matter, 0.6 g⋅kg—1 for total N, 167 mg⋅kg—1 for potassium and 7.6 mg⋅kg—1 for phosphorus.
A two-year fixed position experiment used a completely randomized design for the N application rate. Six N application levels were defined
under M-DF, including 0, 140, 190, 240, 290 and 340 kg⋅ha—1 (referred
to N0, N140, N190, N240, N290 and N340). The N amount of 340 kg⋅ha—1 is widely applied in local high-yield maize fields. The treatments
![]() were replicated three times. There were 18 subplots in total with a dimension of 40 m 6 m with 10 rows per plot. The fertilizer effect in each treatment would continue because the same treatment was set in the same subplot in two years. The experimental layout and treatment plot arrangement was shown in Fig. 1.
were replicated three times. There were 18 subplots in total with a dimension of 40 m 6 m with 10 rows per plot. The fertilizer effect in each treatment would continue because the same treatment was set in the same subplot in two years. The experimental layout and treatment plot arrangement was shown in Fig. 1.
2.2. Agronomic practices
The maize hybrid “Xianyu 335′′ was planted on May 3 in 2015 and
May 2 in 2016. Maize seeds were planted in alternate wide-narrow (80–40 cm) rows with a planting density of 83,330 plants⋅ha—1. Dri- pline with a wall thickness of 0.2 mm, a drip flow of 1.38 L⋅h—1, and a
dripper space of 40 cm were placed in the middle of narrow row. The agricultural plastic film was an ordinary white polyethylene mulching that was 80 cm wide and 0.008 mm thick. A partial-cover method of film mulching was used, in which the narrow space between the dual planted rows was fully covered, but the wider space between the dual rows was only partially covered.
All of the treatments used the same P2O5 and K2O at 135 kg⋅ha—1.
The fertilizer application percentages during maize growing season are shown in Table 1. The starter fertilizer composed of urea (N 46%), calcium superphosphate (P2O5 46%) and potassium sulfate (K2O 52%) was broadcast by the seeder during the planting process. The topdressing fertilizers, which included urea, monoammonium phos- phate (P2O5 61%, N 12%) and potassium chloride (K2O 62%), were applied through the M-DF systems.
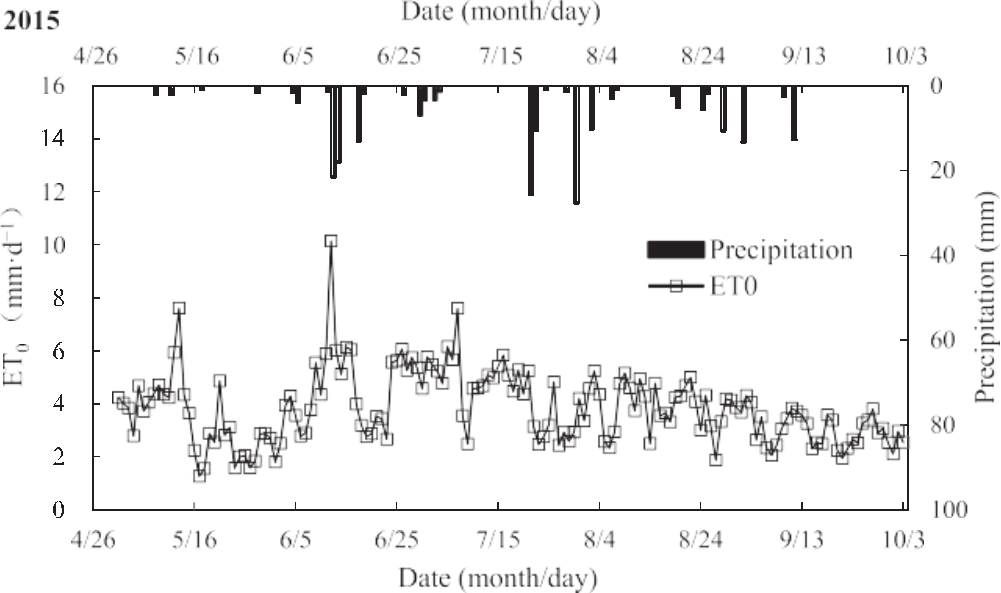
The total precipitation from maize planting to harvest for 2015 was 217 mm and for 2016 was 259 mm. All of the treatments were irrigated according to the average lower irrigation limit and crop water require- ment. The lower limit of irrigation at seedling and mature stages was 70% of field capacity, while for the other growth stages it was 75%. The daily ET0 and precipitation during maize growing seasons in two years were shown in Fig. 2. The irrigation amount (I) was calculated based on Eq. (1).
Where P is the effective precipitation (mm); ET0 is the reference evapotranspiration (mm), calculated with the Penman-Monteith for- mula using the daily weather data collected at the experimental site; and KC is the crop coefficient, the values during maize different growth phases determined by the recommended values of FAO-56 and the conclusions drawn by Kang (2014) at the same experimental site, KC
= 0.5 during seedling stage, KC = 1.0 during jointing stage, KC = 1.2
![]()
![]()
![]()
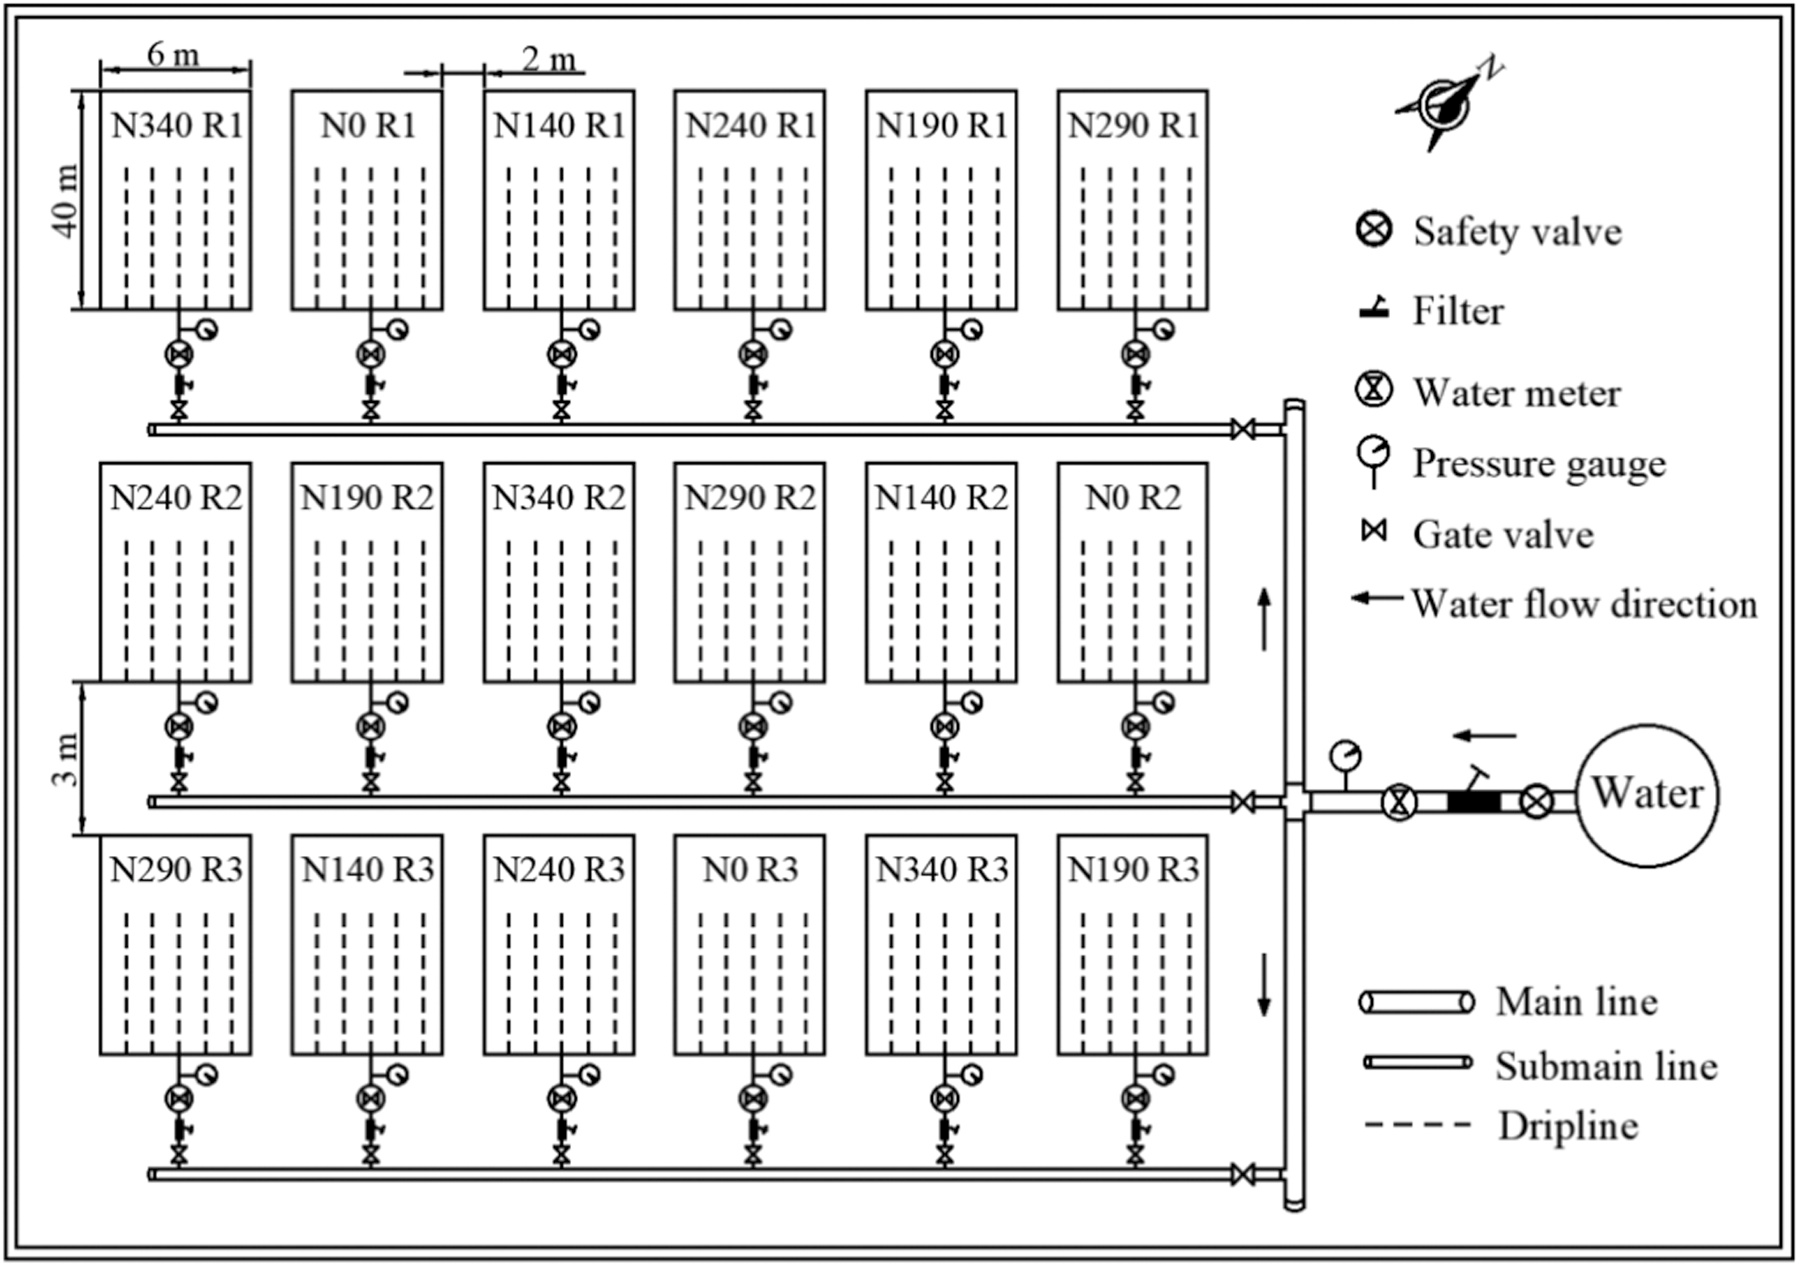
Fig. 1. The experimental layout and treatment plot arrangement. R1 – replicate 1, R2 – replicate 2, R3 – replicate 3.
![]()
Fertilizer application percentages (%) in different growth stages.
![]()
![]() Fertilizer Seeding V6 V12 VT R2 R4 N 20 20 25 15 15 5
Fertilizer Seeding V6 V12 VT R2 R4 N 20 20 25 15 15 5
P2O5 50 15 15 20 – –
K2O 50 30 20 – – –
![]()
V6 – the sixth leaf, V12 – the twelfth leaf, VT – tasseling, R2 – filling, R4 – dough.
![]() during tasseling stage, KC 0.9 during filing stage, and KC 0.6 during dough stage. Based on the research conclusion of Yuan (2015) in the same area, it is reasonable to take 85% of the evapotranspiration of maize under surface irrigation as the irrigation quota of drip irrigation with high yield and water use efficiency.
during tasseling stage, KC 0.9 during filing stage, and KC 0.6 during dough stage. Based on the research conclusion of Yuan (2015) in the same area, it is reasonable to take 85% of the evapotranspiration of maize under surface irrigation as the irrigation quota of drip irrigation with high yield and water use efficiency.
All treatments were irrigated with 30 mm for pre-emergence based on the researches of Uzbek (2013) and Xu (2014) under M-DF in the same experimental site, the irrigation amount from seedling to maturity of maize for 2015 is 160 mm and for 2016 is 130 mm. Both years irri- gated eight times. Other crop management practices were in accordance with those for a local high-yielding farm. Maize was harvested on October 2 in 2015 and on September 28 in 2016.
2.3. Measurements
2.3.1. Sampling and chemical analysis
Before planting, soil samples from 0 to 60 cm were collected to test the soil basic nutrients including organic matter, total N, available phosphorus and potassium.
After final harvest, soil samples of 0–180 cm were collected to analyze the NO–3–N and NH+4 –N residue distribution in soil profile. The
soil sample were collected in between two plants at a horizontal distance of 20 cm from the dripline. The soil NO–3–N and NH+4 –N concentration
were measured using an AA3 continuous flow analyzer (Bran Luebbe,
![]()
![]()
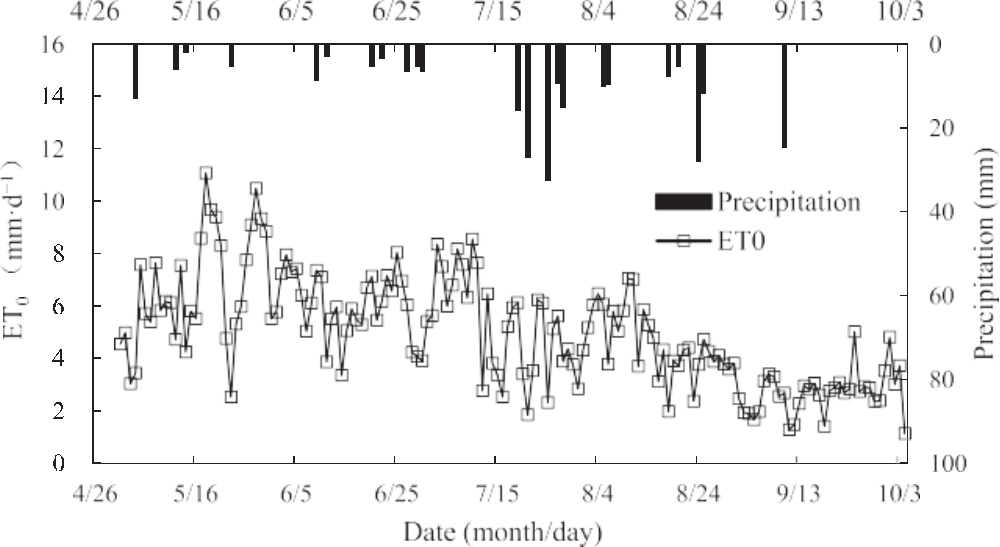
Fig. 2. The daily ET0 and precipitation during maize growing seasons in 2015 and 2016.
![]()
![]()
Germany). The amounts of NO–3–N, NH+4 –N, and inorganic N residue in soil profile were calculated using Eqs. (2)–(4). The soil N relative residue rate (Soil-NRR) was calculated with Eq. (5).
![]()
![]()
![]() RNO— –N = CNO—–N × hi × γi × 10 (2)
RNO— –N = CNO—–N × hi × γi × 10 (2)
2.3.3.
Grain yield
At maturity, the four outermost rows were considered as border rows and were not taken into consideration. Grain yield measurements were made of all plants in a ten-meter swath of the middle six rows in each
![]() plot (10 × 3.6 m2). Grain moisture was measured with a grain moisture
plot (10 × 3.6 m2). Grain moisture was measured with a grain moisture
![]()
![]() 1.8
1.8
RNH+–N = CNH+–N × hi × γi × 10 (3)
2.3.4.
Determination for N fertigation input threshold
4 4
i=0
7 7
The reasonable threshold for N applied was determined based on the
function equations describing the relationships of yield, WUE, and NRE with N application amount. The three corresponding N application
RN = 31 × RNO—3 –N + 11 × RNH+4 –N (4)
![]() Soil — NRR = RN — RN0 × 10 (5)
Soil — NRR = RN — RN0 × 10 (5)
Where RNO— –N is the amount of soil NO—3 –N residue (kg⋅ha–1); RNH+–N is
amounts which corresponded the optimal economic yield and the maximum WUE and NRE respectively were taken as the interval boundary of the N fertigation input threshold.
The optimal economic N amount was calculated according to the assumption that marginal income is equal to marginal cost using Eq.
3 4 (10).
the amount of soil NH+4 –N residue (kg⋅ha–1); CNO—3 –N is the concentration
of soil NO—3 –N; CNH+4 –N is the concentration of soil NH+4 –N; hiis the soil
(10)
thickness (m); γiis the soil bulk density (g⋅cm—3); i is the depth of soil
dx YP
profile (m); RNisthesoil N residue with N fertilizer application (kg⋅ha–1); RN0 isthesoil N residue without N fertilizer application (kg⋅ha–1); Namount is the N application amount (kg⋅ha–1).
Five plants in each plot were selected at different growth stages, including the sixth leaf (V6), the twelfth leaf (V12), tasseling (VT), filling (R2), dough (R4) and physiological maturity (R6) stages. These plants were removed from the soil except for the roots to measure the plant height, stem diameter, leaf area index (LAI), and the N accumu- lation of plant. The LAI was calculated using Eq. (6) (Mckee, 1964).
![]()
Where y is the grain yield, kg⋅ha—1; x is the N amount, kg⋅ha—1; XP is the N price, 0.46 $⋅kg—1; YP is the grain price, 0.28 $⋅kg—1. The prices of N
and maize grain were determined according to local market (Chifeng, China) in the experimental years of 2015 and 2016 (Chifeng Agriculture and Animal Husbandry Bureau).
The N amount corresponding to maximum WUE and NRE was calculated according to the solution of extreme point of regression equation using Eq. (11).
LAI =
i i
i=1
10000
(6)
Where y is the WUE or NRE; x is the N amount.
Where D is the density of seedlings (plants⋅ha—1); L is the length of per
leaf (m); W is the width per leaf (m); and n is the total number of leaves per plant.
Plants were separated into leaves, stems and ears, then they were heat-treated and crushed to test the concentration of N for different plant organs (Kjeldahl method). The N recovery efficiency (NRE) was calculated by Eq. (7).
Where NAN is the N accumulation of plant with N fertilizer applied (kg⋅ha–1); NAN0 is the N accumulation of plant without N fertilizer
2.4.
Statistical analysis
Data were analyzed using one-way ANOVA at a 0.05 significance level to identify differences among the treatments. Plotting was per- formed using Microsoft Excel 2016.
3.1. Plant height, stem diameter and LAI
![]() The plant height, stem diameter and LAI throughout maize entire growing season among the treatments with different N application
The plant height, stem diameter and LAI throughout maize entire growing season among the treatments with different N application
applied (kg⋅ha–1).
2.3.2. Crop evapotranspiration and water use efficiency
Maize seasonal evapotranspiration (ETC) was calculated using the water balance as shown in Eq. (8). The water use efficiency (WUE,
kg⋅ha—1⋅mm—1) was calculated using Eq. (9).
ETC = P + I + U — R — ∆W — D (8)
amount are shown in Tables 2 4.
![]() There was a significant (p 0.05) effect of N amount on the plant height throughout maize growing season except for the plant height at the seedling stage in 2015. The plant height after tasseling tended to be stable and increased with the increase in N amount applied. The plant height of N140 and N190 treatments showed no significant difference from N0 treatment, which were within 285.1–302.5 cm on average of two years, while the plant height among the treatments of N240, N290
There was a significant (p 0.05) effect of N amount on the plant height throughout maize growing season except for the plant height at the seedling stage in 2015. The plant height after tasseling tended to be stable and increased with the increase in N amount applied. The plant height of N140 and N190 treatments showed no significant difference from N0 treatment, which were within 285.1–302.5 cm on average of two years, while the plant height among the treatments of N240, N290
![]() WUE = Yield
WUE = Yield
(9)
and N340 was much higher (22.6–29.7 cm on average) than N0 treatment.
![]()
![]()
Where U is the seasonal capillary rise to the root zone in mm (U was negligible since the groundwater table was 20–30 m below the soil surface). R is the seasonal runoff in mm (The field was flat without
borders, no R was observed in the field because the precipitation in- tensity was low). ∆W is the change in soil water storage, (mm). D is the seasonal deep percolation in mm. The soil moisture at the bottom of the
main root zone didn’t exceed the filed capacity. Thus, the D was negli- gible since the small precipitation intensity and well-designed irrigation scheduling (Qi et al., 2019; Wang et al., 2019a; Zhou et al., 2018).
The N amount had a significant effect on stem diameter throughout the growing season and the stem diameter increased with an increase in N amount. At maturity stage, the stem diameter of N140 and N190 treatments showed no significant difference, while the stem diameter among the treatments of N240, N290 and N340 significantly increased by 13.2–18.2% compared to N0 treatment.
The Table 4 showed that the LAI responded positively to the increase in N amount before maize filling (R2 stage), while the LAI in treatment with high N input (N340) decreased more obviously due to premature leaf senescence in late-growth season compared to other treatments. It
![]()
![]()
![]()
 The plant height (cm) in days after emergence throughout maize entire growing season under different N fertigation.
N140 38.8 ± 3.2a 122.2 ± 3.2ab 257.4 ± 9.0ab 307.9 ± 4.7ab 306.1 ± 6.4ab 36.4 ± 0.9ab 102.3 ± 2.6a 228.1 ± 8.2ab 296.0 ± 6.3ab 294.6 ± 3.0ab
N190 39.4 ± 2.6a 125.9 ± 4.8ab 257.1 ± 10.4ab 310.2 ± 5.0ab 307.8 ± 4.5ab 37.1 ± 0.6ab 108.3 ± 4.8ab 236.2 ± 5.6ab 296.7 ± 8.8ab 295.2 ± 3.6ab
N240 39.3 ± 2.2a 129.6 ± 5.5ab 258.7 ± 9.1ab 314.8 ± 4.3b 312.4 ± 6.3b 37.3 ± 1.9ab 115.6 ± 10.3b 243.0 ± 5.9ab 302.0 ± 5.2b 301.7 ± 4.6b
N290 40.0 ± 4.2a 133.0 ± 5.8b 262.5 ± 8.0ab 314.7 ± 7.4b 314.5 ± 7.2b 37.6 ± 1.3ab 121.1 ± 8.7b 248.7 ± 4.4ab 309.0 ± 6.1b 306.6 ± 4.3b
N340 40.6 ± 2.7a 134.1 ± 6.5b 266.0 ± 10.4b 316.9 ± 11.8b 317.0 ± 6.1b 39.3 ± 0.8b 125.7 ± 9.3b 253.4 ± 10.4b 313.5 ± 10.3b 311.8 ± 10.3b
![]()
F- test value 0.2 4.7* 3.3* 3.2* 5.9** 3.2* 3.8* 3.5* 5.7* 8.4*
1 Different lowercase letters in the same column indicate significance (p < 0.05), while the same letter indicates non-significance.
2 * Indicates significance at p < 0.05 level, while ** indicates significance at p < 0.01 level.
![]() Table 3
Table 3
 The stem diameter (cm) in days after emergence throughout maize entire growing season under different N fertigation.
N140 0.97 ± 0.03a 2.38 ± 0.07ab 2.84 ± 0.16ab 2.56 ± 0.09ab 2.54 ± 0.08ab 0.94 ± 0.06ab 2.28 ± 0.21a 2.82 ± 0.20ab 2.57 ± 0.12ab 2.47 ± 0.04ab
N190 1.16 ± 0.04b 2.42 ± 0.08ab 2.93 ± 0.12ab 2.62 ± 0.07abc 2.58 ± 0.11ab 0.98 ± 0.02ab 2.31 ± 0.28a 2.86 ± 0.06ab 2.67 ± 0.07ab 2.52 ± 0.09ab
N240 1.13 ± 0.06b 2.48 ± 0.10ab 2.96 ± 0.13ab 2.74 ± 0.07bc 2.63 ± 0.09b 1.03 ± 0.03ab 2.38 ± 0.19a 2.95 ± 0.06ab 2.72 ± 0.14b 2.62 ± 0.09b
N290 1.22 ± 0.04b 2.55 ± 0.12b 3.05 ± 0.07c 2.80 ± 0.08cd 2.64 ± 0.09b 1.03 ± 0.13ab 2.42 ± 0.23ab 2.97 ± 0.32ab 2.74 ± 0.21b 2.65 ± 0.11b
N340 1.19 ± 0.04b 2.57 ± 0.09b 3.06 ± 0.16c 2.90 ± 0.16d 2.71 ± 0.06b 1.09 ± 0.01b 2.50 ± 0.09b 3.22 ± 0.03b 2.78 ± 0.14b 2.68 ± 0.19b
![]()
F- test value 10.84** 3.80* 3.70* 8.69** 3.16* 3.23* 0.70 3.47* 4.19* 4.31*
1 Different lowercase letters in the same column indicate significance (p < 0.05), while the same letter indicates non-significance.
2 * Indicates significance at p < 0.05 level, while ** indicates significance at p < 0.01 level.
![]()
![]()
![]()
![]()
![]()
![]()
![]()
![]()
![]()
![]()
![]()
![]()
![]()
![]()
![]() can be seen that the LAI (5.1–5.3) of N340 treatment during 64–69 days after emergence was the maximum among all of the treatments, while the LAI of N340 treatment during 114–118 days decreased to 3.14–3.24, which was even lower than that of N190 treatment. The LAI among N190, N240, and N290 treatments maintained high values throughout the growing seasons.
can be seen that the LAI (5.1–5.3) of N340 treatment during 64–69 days after emergence was the maximum among all of the treatments, while the LAI of N340 treatment during 114–118 days decreased to 3.14–3.24, which was even lower than that of N190 treatment. The LAI among N190, N240, and N290 treatments maintained high values throughout the growing seasons.
![]()
![]()
![]()
![]()
![]()
![]() 3.2. Plant N accumulation and N recovery efficiency
3.2. Plant N accumulation and N recovery efficiency
![]()
![]()
![]()
![]()
![]()
![]()
![]()
![]()
![]()
![]() The N accumulation (NA) during maize growing season for all plant components and entire plant for the different treatments are shown in the Fig. 3. The results for both years showed the same variation ten- dency. The total NA of the plant increased throughout the growing season. The NA of leaves and stems increased first and then decreased with the development of maize growth, and both of them reached the highest values around VT stage. While the NA of ears gradually increased starting at the beginning of reproductive growth period due to the transportation of N from leaves and stems.
The N accumulation (NA) during maize growing season for all plant components and entire plant for the different treatments are shown in the Fig. 3. The results for both years showed the same variation ten- dency. The total NA of the plant increased throughout the growing season. The NA of leaves and stems increased first and then decreased with the development of maize growth, and both of them reached the highest values around VT stage. While the NA of ears gradually increased starting at the beginning of reproductive growth period due to the transportation of N from leaves and stems.
![]()
![]()
![]()
![]()
![]()
![]()
![]()
![]()
![]()
![]()
![]()
![]()
![]()
![]()
![]()
 There was no obvious difference in the NA of plant at seedling stage. During the V6–VT period, the NA of leaves and stems under the treat- ments with varying N application levels showed no significant differ- ence, but noticeably improved 38.8–78.6% and 32.8–66.9% compared with N0 treatment. After maize tasseling, the differences in the NA of entire plant across the treatments were more obvious and were mainly reflected in the NA of ears. The NA of ears accounted for 38.5–50.3% at VT–R2 stage, 57.8–69.5% at R2–R4 stage, and 71.6–77.7% at R4–R6 stage of the total NA of plants on average among the treatments. The
![]() effect of N fertilizer amount on the NA of ears reached significant level (P < 0.05) during maize reproductive period. The NA of ears improved
effect of N fertilizer amount on the NA of ears reached significant level (P < 0.05) during maize reproductive period. The NA of ears improved
significantly when the N amount ranged from 0 to 240 kg⋅ha—1; while
![]()
![]()
![]()
![]()
![]()
![]()
![]()
![]()
![]()
![]()
![]() the NA of ears showed no significant changes among the treatments of N240, N290 and N340. The relationship of the NA of entire plant with N fertilizer amount in the reproductive period showed the same variation tendency as that of the NA of ears with N fertilizer amount. Take the R2–R4 stage as an example, when the N amount was between 0 and
the NA of ears showed no significant changes among the treatments of N240, N290 and N340. The relationship of the NA of entire plant with N fertilizer amount in the reproductive period showed the same variation tendency as that of the NA of ears with N fertilizer amount. Take the R2–R4 stage as an example, when the N amount was between 0 and
240 kg⋅ha—1, each 50 kg⋅ha—1 increase in N amount caused a
![]()
![]()
![]()
![]()
![]()
![]() 19.9–22.9% and 15.6–17.0% improvement in the NA of ears and the entire plant, respectively. However, the increasing ratio of NA for ears and the entire plant dropped until negative growth appeared when the N
19.9–22.9% and 15.6–17.0% improvement in the NA of ears and the entire plant, respectively. However, the increasing ratio of NA for ears and the entire plant dropped until negative growth appeared when the N
amount exceeded 240 kg⋅ha—1.
![]()
![]()
![]()
![]()
![]()
![]()
![]()
![]()
![]()
![]()
![]()
![]()
![]()
![]()
![]()
![]()
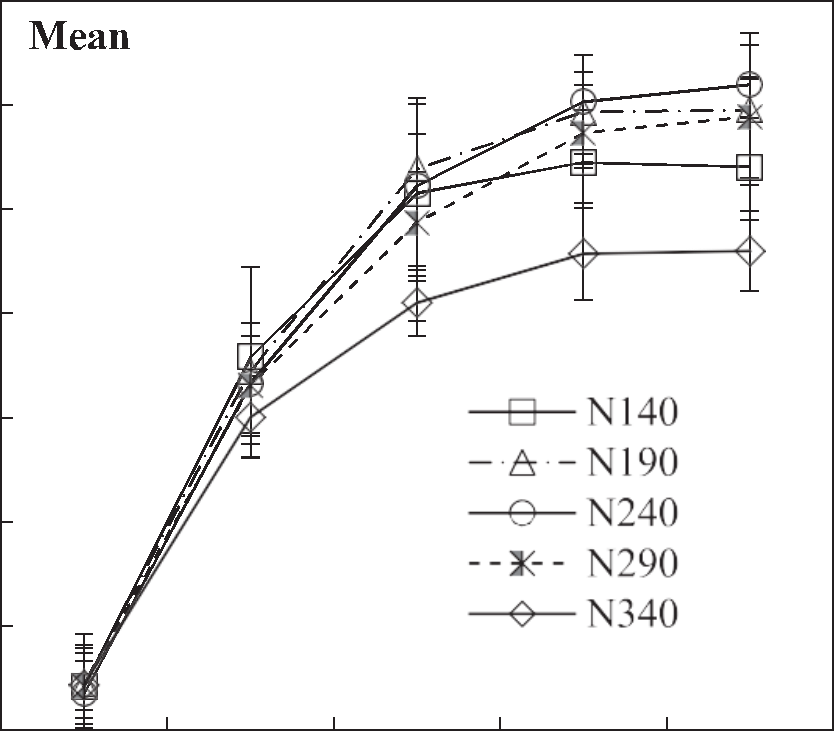
![]() On average over two years, the N recovery efficiency (NRE) of plant for the different growth stages and among the treatments is shown in Fig. 4. The NRE gradually increased with the development of maize growth, while the increasing ratio declined after maize tasseling. Take the N240 treatment as an example, the NRE from maize tasseling to filling increased 8.1% points, while the NRE from maize filling to maturity increased 1.6% points. There was no significant difference in the NRE among the treatments before maize tasseling, whereas the difference in NRE across treatments was gradually noticeable with the start of reproductive growth. After maize tasseling, the NRE showed a trend of increasing first and then decreasing with the increase of N amount. From maize filling to maturity, the values of NRE reached the
On average over two years, the N recovery efficiency (NRE) of plant for the different growth stages and among the treatments is shown in Fig. 4. The NRE gradually increased with the development of maize growth, while the increasing ratio declined after maize tasseling. Take the N240 treatment as an example, the NRE from maize tasseling to filling increased 8.1% points, while the NRE from maize filling to maturity increased 1.6% points. There was no significant difference in the NRE among the treatments before maize tasseling, whereas the difference in NRE across treatments was gradually noticeable with the start of reproductive growth. After maize tasseling, the NRE showed a trend of increasing first and then decreasing with the increase of N amount. From maize filling to maturity, the values of NRE reached the
![]()
 maximum in N240 treatment and decreased significantly when the N amount exceeded 290 kg⋅ha—1. It can be seen, the N240 treatment
![]()
![]()
![]()
![]()
![]()
![]() improved 5.9–7.9 and 14.6–16.0% points in NRE compared with N140 and N340 respectively during this period.
improved 5.9–7.9 and 14.6–16.0% points in NRE compared with N140 and N340 respectively during this period.
![]() 3.3. The concentration of NO–3–N and NH+4 –N, and the soil N residue in soil profile
3.3. The concentration of NO–3–N and NH+4 –N, and the soil N residue in soil profile
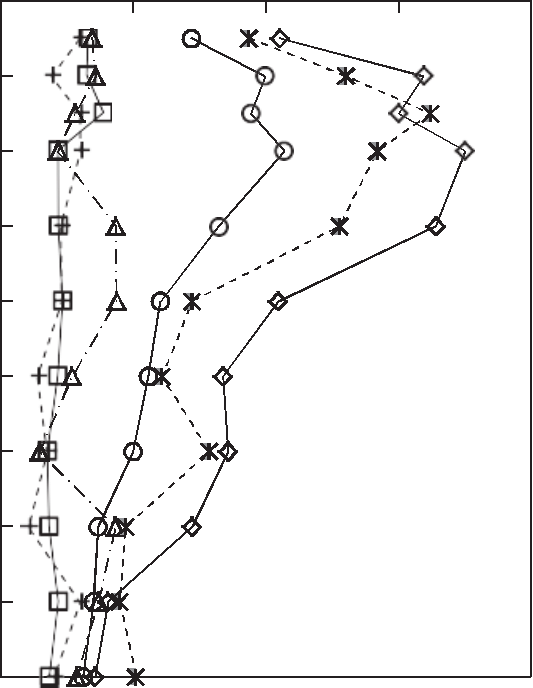
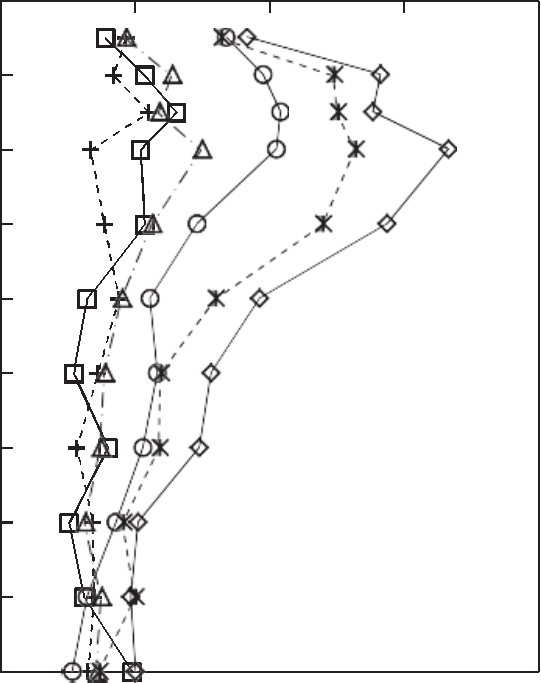
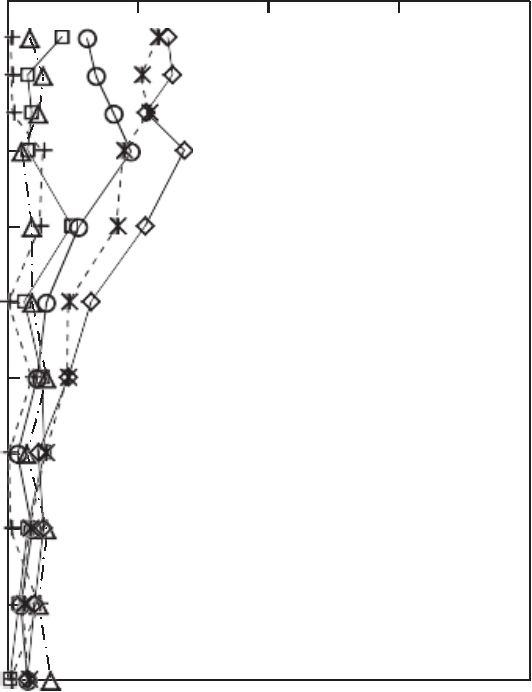
![]() Fig. 5 shows the distributions of NO–3–N and NH+4 –N in 0–180 cm soil profile under different N application levels for two years at maturity.
Fig. 5 shows the distributions of NO–3–N and NH+4 –N in 0–180 cm soil profile under different N application levels for two years at maturity.
![]() The NO–3–N increased with the soil depth in a range of 0–40 cm and then decreased in deeper layers; while the NH+4 –N was almost decreasing with the depth in 0–180 cm soil profile. The concentration of NO–3–N and NH+4 –N in soil profile showed an increasing tendency with the increase
The NO–3–N increased with the soil depth in a range of 0–40 cm and then decreased in deeper layers; while the NH+4 –N was almost decreasing with the depth in 0–180 cm soil profile. The concentration of NO–3–N and NH+4 –N in soil profile showed an increasing tendency with the increase
![]()
![]()
![]()
![]()
![]()
![]()
![]()
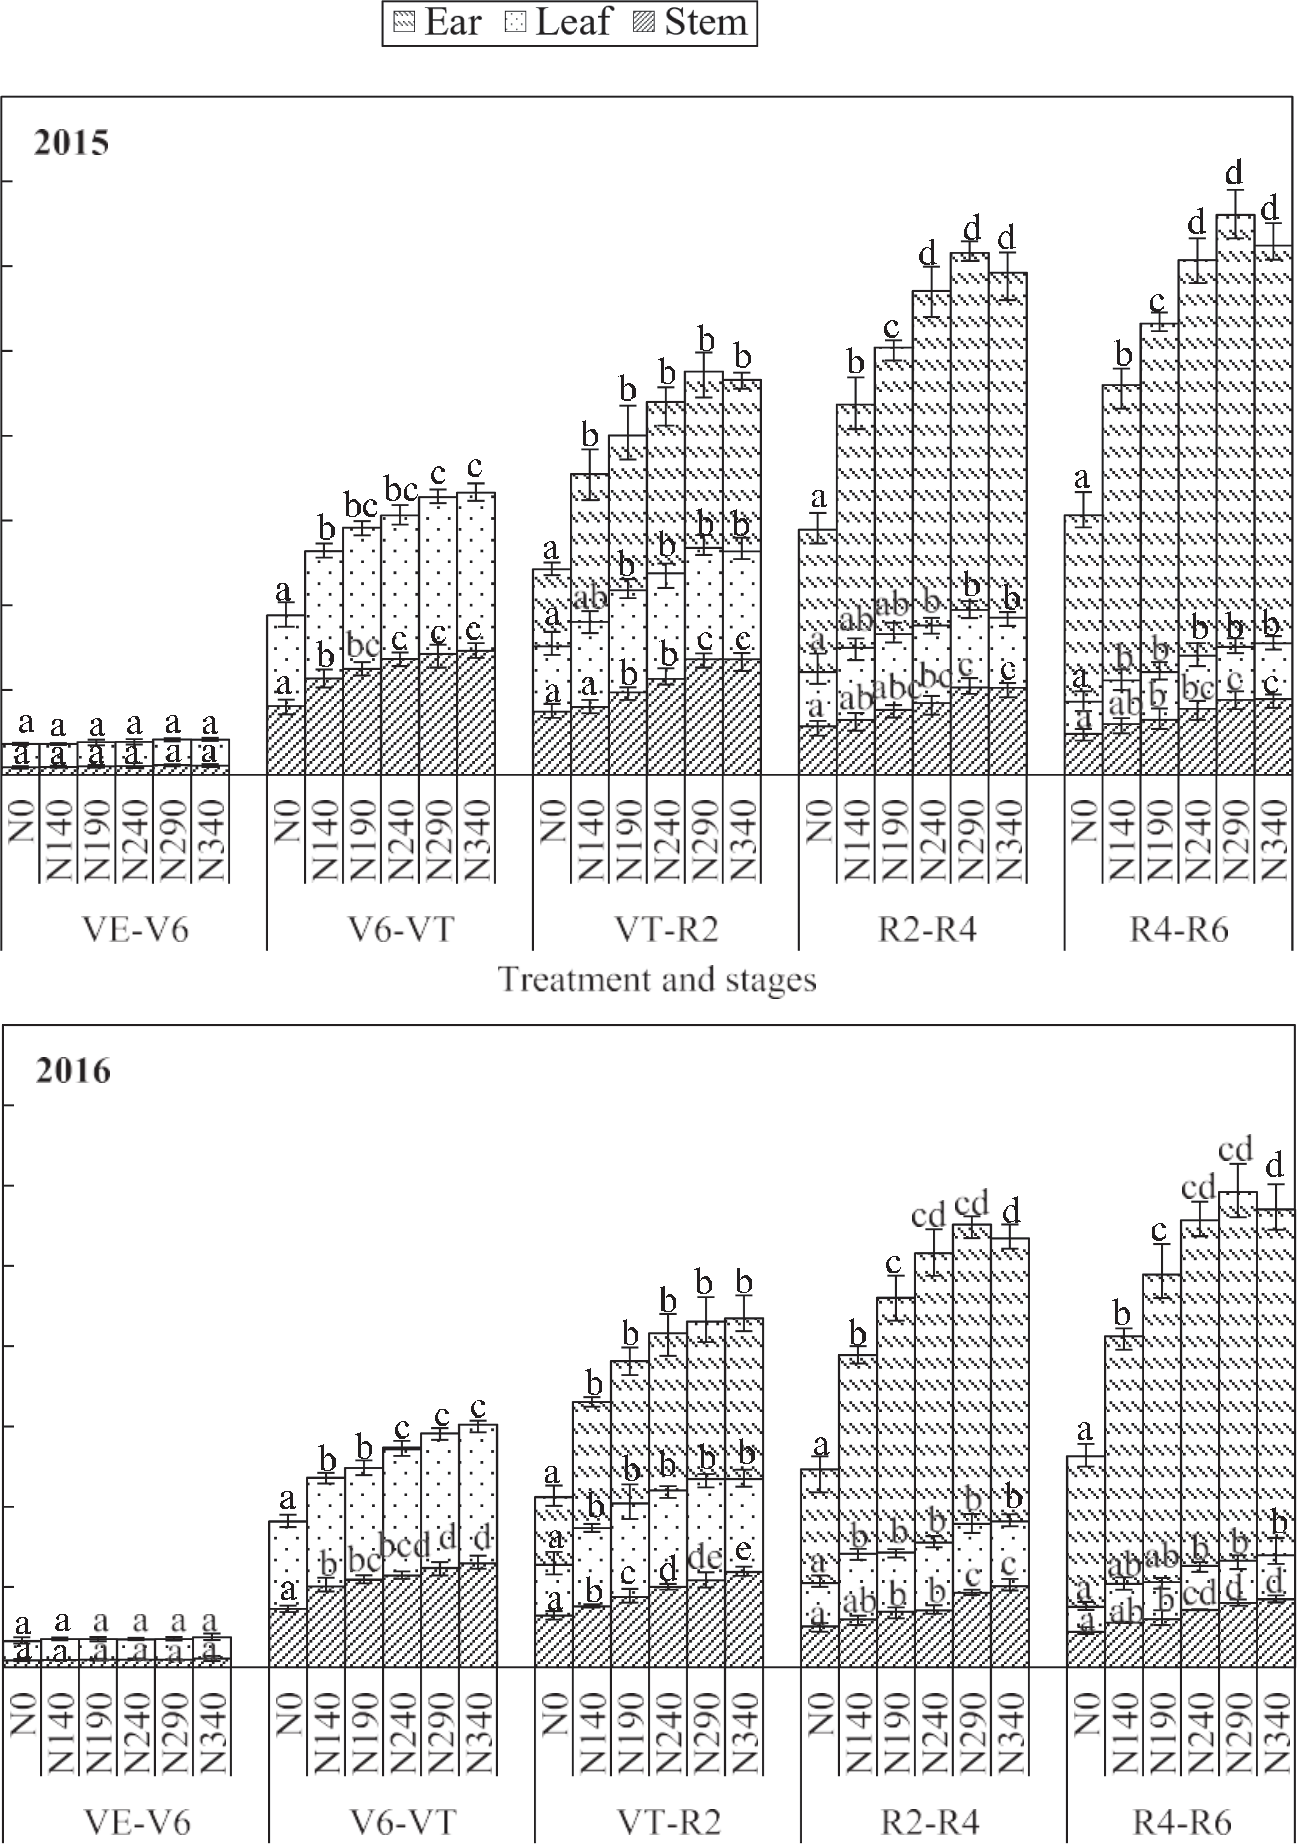 Fig. 3. The N accumulation of different plant components in varying growth stages for maize. V6 – the sixth leaf, VT – tasseling, R2 – filling, R4 – dough, R6 –
physiological maturity.
![]()
![]()
![]()
![]()
![]()
![]()
![]()
![]()
![]()
![]()
![]()
![]()
![]()
![]()
![]()
![]() in N amount. There was no obvious change of the inorganic N residue at different depths of soil when the N amount was less than 190 kg⋅ha—1.
in N amount. There was no obvious change of the inorganic N residue at different depths of soil when the N amount was less than 190 kg⋅ha—1.
While the inorganic N concentration increased noticeably after the N amount exceeded 190 kg⋅ha—1.
The concentration of NO–3–N in soil was much higher than NH+4 –N in
all treatments. And the differences in the inorganic N among the treat- ments were more noticeable at a depth of 0–60 cm. For example, compared with N0 treatment, the NO–3–N concentration at the depth of 0–60 cm in N140, N240 and N340 treatment increased 1.2, 11.3 and
21.7 mg⋅kg—1 respectively on average of two years. There were different
effects of N amount on the concentration of NO–3–N and NH+4 –N in deeper soil layer (80–180 cm). The results showed that the NO–3–N
concentration at the depth of 80–180 cm increased obviously when the N amount exceeded 190 kg⋅ha—1, while the NH+4 –N concentration changed little in these soil layers. For example, the NO–3–N concentration in treatments of N240, N290 and N340 was 8.9–13.6 mg⋅kg—1, while the NH+4 –N concentration in these treatments was 2.7–4.6 mg⋅kg—1 in 2016.
It can be concluded that increasing N amount promotes deep movement
of NO–3–N in soil, but has little effect on the migration of NH+4 –N.
At maturity, the amounts of NO–3–N and NH+4 –N residue as well as the
inorganic N in soil profile increased with the increase in N amount (Table 5). All three of these indexes significantly increased when the N
application amount exceeded 190 kg⋅ha—1. The soil N residue decreased
the second year when the N amount was within 0–190 kg⋅ha—1: the soil
N residue of N0, N140 and N190 treatments decreased 38.4%, 39.0% and 24.9% respectively the second year. While the soil N residue in N240 treatment was almost the same between years. By contrast, the soil N residue increased obviously by year when the N amount exceeded
290 kg⋅ha—1: the soil N residue of N290 and N340 treatments increased
11.5% and 8.8% respectively the second year. The soil N relative residue rate (soil-NRR) between N290 and N340 treatments showed no signifi- cant difference but significantly increased 11.3–26.5% points compared with other treatments on average of two years, while the N140 and N190 treatments have low soil-NRR (8.7% and 13.3% respectively), which may decrease the soil fertility by years.
![]()
![]()
![]()
![]()
![]()
![]()
![]()
![]()
![]()
![]()
![]()
![]()
![]()
Fig. 4. The N recovery efficiency of plant in different growth stages for maize. V6 – the sixth leaf, VT – tasseling, R2 – filling, R4 – dough, R6 – physiological maturity NRE – N recovery efficiency of plant.
![]() 3.4. Maize yield, water use efficiency, and N recovery
3.4. Maize yield, water use efficiency, and N recovery
The results in Table 5 show that maize yield, ETC, WUE, NA and NRE of plants at maturity stage for both years showed the same variation tendency of increasing initially and then decreasing with the increase in N rate.
Maize yield in N240 treatment was the highest and showed no sig- nificant difference from the yield of N290 treatment, but it was 7.2–53.8% higher than the yield of other treatments for two years on average. The ETC of treatments with N fertilizer application showed no significant difference but was 3.0–9.3% higher than the ETC of N0 treatment for two years on average. The ETC of N290 treatment was the highest for two years. The WUE of treatments with N fertilizer appli- cation was 27.8–42.3% higher than that of N0 treatment. The WUE of
N240 treatment was the highest, amounting to 37.9 kg⋅ha—1⋅mm—1 on
average for two years.
The total NA of plant at maturity for N240, N290 and N340 treat- ments showed no significant difference, but it was significantly (P < 0.05) higher than that in N0, N140 and N190 treatments. The N240 treatment obtained the highest NRE, amounting to 62.0% on average of two years. The NRE of plants for N190 and N290 treatments showed no significant difference from N240 treatment, while there was a drop in the NRE by 7.9% points for N140 treatment and 16.0% points for N340 treatment, compared to N240 treatment for two years on average.
Maize yield responded positively to the NA of plant. For both years, each 50 kg⋅ha—1 increase in N amount caused an average 16.7%
improvement for NA of plant and 9.1% for yield when the N amount was between 0 and 240 kg⋅ha—1; while the increasing rate of yield and NA for plant declined when the N amount exceeded 240 kg⋅ha—1. The N240
treatment obtained the highest yield, WUE and NRE, which were 2.2–53.7%, 4.4–35.0% and 14.8–35.0% respectively higher than those in other treatments for two years on average.
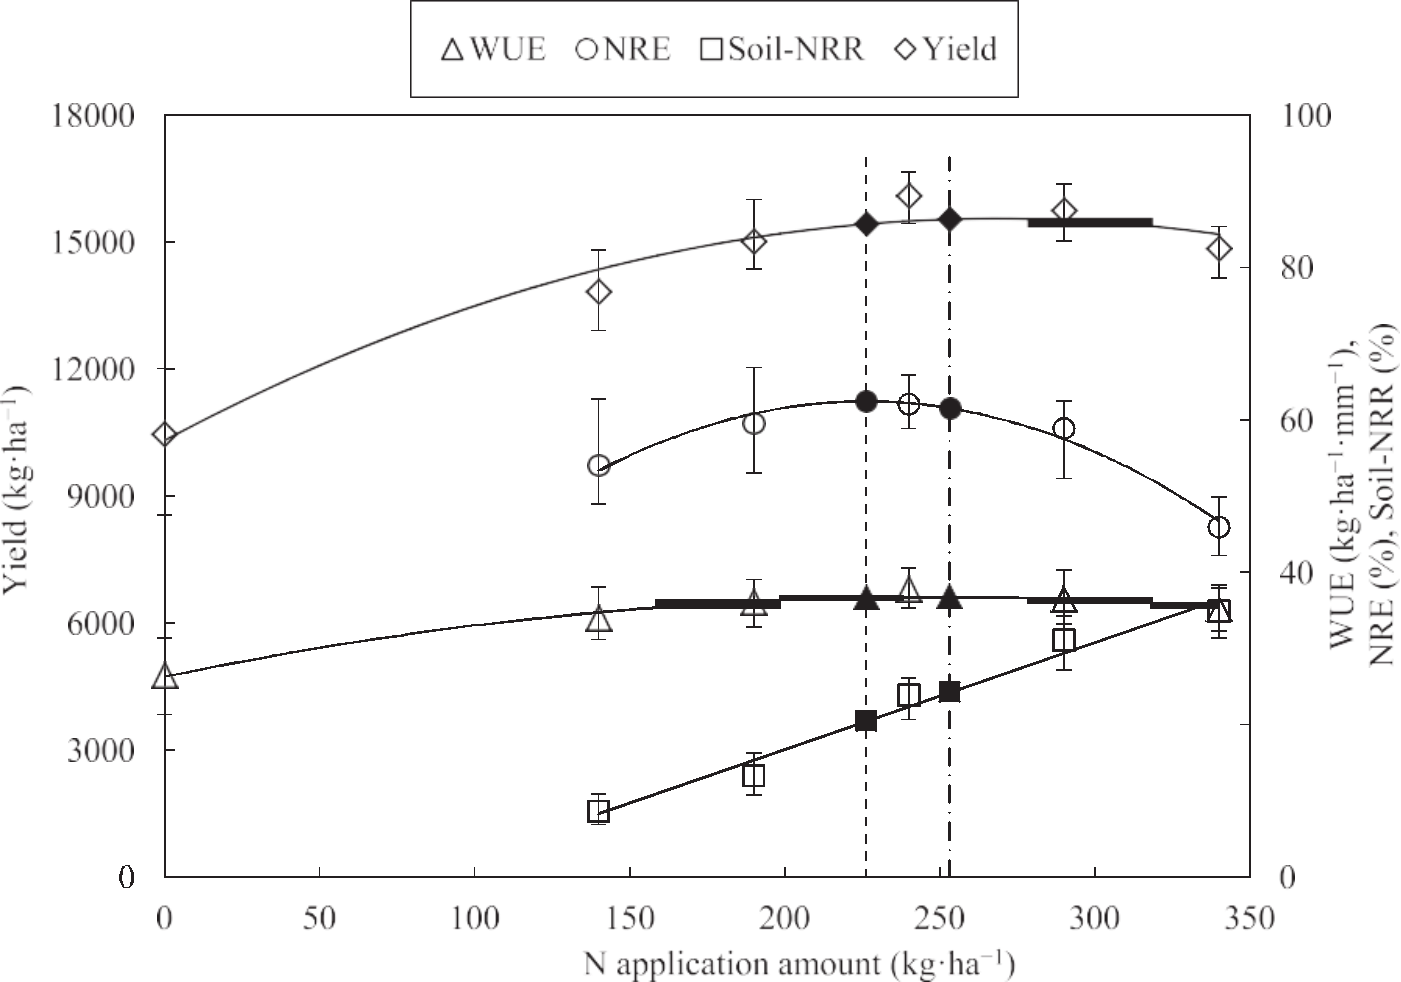
The Fig. 6 showed that the function equations of maize yield, WUE and NRE related to N amount showed quadratic parabola relationships, which were in line with the theory of diminishing returns in agriculture; while the soil-NRR related to N amount showed a positive linear rela- tionship. All of the function equations fitted well through an F test
(p < 0.01). According to the assumption that marginal income is equal to marginal cost, the optimal economic N amount was 253 kg⋅ha—1 with the target yield of 15545 kg⋅ha—1. Based on the method to solve the
extreme point of regression equation, the equation of WUE vs. N amount
obtained the highest WUE of 36.8 kg⋅ha—1⋅mm—1 when the N amount was at 251 kg⋅ha—1; while for the NRE vs. N amount equation, the NRE
 reached the maximum value of 62.4% when the N amount was 226 kg⋅ha—1. In the field experiments, the N input of 240 kg⋅ha—1, which was within the range of 226–253 kg⋅ha—1, obtained the highest yield,
WUE and NRE, which presented high consistency with the fitted results of these function equations. It can be concluded that the input threshold
of 226–253 kg⋅ha—1 for N fertilizer can ensure high yield and resource
use efficiency, and the corresponding soil-NRR were 20.4–24.2%, which
decreased by 12.2–16.0% points compared with that under conventional N application amount of 340 kg⋅ha—1.
4.1. Appropriate N application under M-DF improves maize growth and N accumulation
Water and nutrients in soil are fundamental to crop productivity, sufficient water ensures nitrogenous fertilizer effect on crop (Wang et al., 2019b; Zhang et al., 2019). This study used the technique of mulched drip fertigation (M-DF) with an irrigation regime according to the demand of maize, which provides a suitable soil moisture environ- ment to the movement and mobilization of soil nutrition. Nitrogen plays a major role in the growth and development of plant, and it affects almost all of the metabolic processes (Lea and Miflin, 2011; Leghari et al., 2016). Plant height, stem diameter, and LAI are important to assess plant growth given that they reflect the amount of light inter- ception of the canopy, which influences the extent of photosynthesis and final biomass yield (Elia and Conversa, 2012). The results of this study showed that the application of N fertilizer improved plant height, stem diameter and LAI compared to N0 treatment, whereas the growth in- dexes above showed no significant differences among N240–N340 treatments. Excessive N application may lead to high activity of nitrate reductase, excessive vigorous N metabolism and too much exhaustion of carbohydrate in ear leaf, which resulted in the lack of enough carbo- hydrate in the lower leaf, then the early senescence occurred (He et al., 1998; Liu et al., 2007). Thus, the LAI plummeted due to premature leaf senescence in treatment with high N amount (N340) during late- growth period. It can be concluded that N fertilizer promote maize growth, but
the promoting effect weakened after the N amount exceeded 240 kg⋅ha—1.
Maize grows through the physiological process of N accumulation (NA). The N application amount had obvious effect on the NA of varying plant components as well as the entire plant. The NA of each plant component improved significantly when the N amount increased be-
tween 0 and 240 kg⋅ha—1. There was no significant increase in NA of the
entire plant when the N amount exceeded 240 kg⋅ha—1, perhaps because
the supra-optimal N inputs far exceeded the demands for plant growth and no longer contributed to the processes of photosynthesis and assimilation (Li and Ma, 2018), and may cause damage for enzyme of the sort associated with crop growth, including nitrate reductase, glutamine synthetase and glutamate synthase in leaves (Xu et al., 2018), urease and catalase in soil (Zhang et al., 2016). The differences in total NA of plant across the treatments gradually increased after maize tasseling, and the differences were mainly reflected in the NA of ears. A sufficient level of N was found in plant vegetative organs to serve as an N source to reproductive structures. In general, over the two years, the NA of plant during VT–R6 period among the treatments with different N application levels accounted for 42.7–50.7% of the total NA for the whole growing season, and the NA of ears accounted for 75.3–77.7% of the NA for entire plant at maturity. Gao et al. (2000) found that the ratio of the plant NA before and after tasseling of spring maize with super high yield
(>15000 kg⋅ha—1) was 72:28 under surface irrigation; Hou et al. (2019)
found that the plant NA before and after maize tasseling stage was in the proportion of 60:40 using M-DF with super high yield. In this study, the ratio of the plant NA during VE–VT period to VT–R6 period stands at
![]()
![]()
![]()
![]()
![]()
![]()
![]()
![]()
![]()
![]()
![]()
![]()
![]()
![]()
![]()
![]()
Fig. 5. TheNO—3 –N and NH+4 –N concentrations in 0–180 cm soil profile for different N application levels after maize harvest. Data of NO–3–N from Wang et al. (2018).
![]()
![]()
![]()
![]()
![]()
![]()
![]()
![]()
![]()
![]()
![]()
![]()
![]()
![]()
![]()
![]()
![]()
![]()
![]()
![]()
![]()
![]()
![]()
![]()
![]()
![]()
![]()
![]()
![]()
![]()
![]()
![]()
![]()
![]()
![]()
![]()
![]()
![]()
![]()
![]()
![]()
![]()
 53.3:46.7 on average across the treatments under M-DF, and the ratio in the optimal treatment (N240) was 49.3:50.7. It can be concluded that the M-DF technique combined with appropriate N application improved the proportion of N translocation from plant vegetative organs to grain. Due to the N demand during late-growth stages, several studies also reported that in-season fertigation benefits maize yield (Liu et al., 2014; Sui et al., 2018).
4.2. Appropriate N application under M-DF decreases soil N residue
The distribution of NO–3–N and NH+4 –N in soil profile at depths of 0–180 cm showed that the N residue in soil mainly distributed at depth of 0–60 cm in harvest season under M-DF. Because the fertilizer moves with water in soil, the inorganic N mainly accumulated within the wetted volume of M-DF. On the other hand, the decomposed N was
![]()
![]()
![]()
 absorbed into the root layer of maize where there is plentiful humus (Zhang et al., 2016). The residue amounts of both NO–3–N and NH+4 –N in soil increased with the increase in N amount, and the NO–3–N concen- tration in soil was much higher than NH+4 –N. The inorganic N content in
soil indicates the soil fertility. In this study, the soil inorganic N amount
after harvest was basically balanced for two years in N240 treatment, while the soil N nutrient in treatments of N140 and N190 decreased by year, implying that insufficient N application amount led to a decrease in soil fertility. However, excessive N fertilizer resulted in large amount of inorganic N residue, the readings showed that the soil N relative residue rate at depth of 0–180 cm in N290 and N340 treatments increased 7.6% and 11.3% points, respectively, compared to N240
treatment over two years. Because of the high mobility of NO–3–N
(Karandisha and Sˇimůnek, 2017), the masses of NO–3–N in soil at depth of 80–180 cm obviously increased under excessive N fertilizer conditions
![]()
![]()
![]() Maize yield, ETC, WUE, N accumulation and N recovery efficiency of plant, soil inorganic N residues and N relative residue rate at maturity.
Maize yield, ETC, WUE, N accumulation and N recovery efficiency of plant, soil inorganic N residues and N relative residue rate at maturity.
![]()
Year Treatment Yield (kg⋅ha–1) ETC (mm) WUE
(kg⋅ha—1⋅mm—1)
NA
(kg⋅ha—1)
NRE(%) NO–3 residue (kg⋅ha–1)
NH+4
residue (kg⋅ha–1)
N soil residue (kg⋅ha–1)
Soil-NRR
(%)
![]()
2015 N0 11,738 ± 198a 386 ± 8a 30.4 ± 0.8a 153 ± 17a – 204 ± 8a 16 ± 1a 56 ± 2a –
N140 14,252 ± 515b 394 ± 5ab 36.2 ± 1.1b 230 ± 4b 54.8 ± 5.8b 219 ± 14ab 34 ± 2b 71 ± 4b 10.8 ± 1.4a
N190 15,260 ± 528c 402 ± 8ab 38.0 ± 0.6bc 266 ± 6c 59.5 ± 1.4c 243 ± 11b 41 ± 1c 80 ± 3.2c 12.9 ± 0.8a
N240 16,243 ± 322d 407 ± 11ab 39.9 ± 0.9c 304 ± 13d 62.9 ± 3.0c 319 ± 15c 49 ± 3d 103 ± 5d 19.5 ± 1.4b
N290 16,021 ± 315d 416 ± 11b 38.5 ± 1.7bc 330 ± 20d 61.1 ± 1.6c 409 ± 15d 58 ± 4e 129 ± 1.4e 25.2 ± 0.2c
N340 15,175 ± 181c 408 ± 7ab 37.2 ± 0.4bc 312 ± 7d 46.8 ± 0.6a 485 ± 13e 76 ± 4 f 158 ± 1.9f 29.9 ± 0.1d
F-test value
39.9** 3.3* 22.2** 54.9** 18.9** 157.5** 110.1** 302.4** 139.1**
2016 N0 9203 ± 534a 406 ± 16a 22.7 ± 1.7a 132 ± 10a – 115 ± 7a 13 ± 1a 34 ± 1.4a –
N140 13,421 ± 506b 422 ± 7ab 31.8 ± 1.3b 207 ± 5b 53.3 ± 3.7ab 120 ± 8a 26 ± 2b 43 ± 2.9b 6.4 ± 2.1a
N190 14,784 ± 327c 432 ± 12ab 34.3 ± 1.7bc 245 ± 13c 59.5 ± 6.6b 180 ± 19b 31 ± 3b 60 ± 5.8c 13.7 ± 3.1b
N240 15,953 ± 392d 445 ± 6b 35.9 ± 1.0c 278 ± 3d 61.2 ± 1.4b 323 ± 12c 46 ± 3c 102 ± 4.4d 28.3 ± 1.8c
N290 15,480 ± 390 cd 449 ± 10b 34.5 ± 0.7bc 296 ± 10d 56.7 ± 3.6b 450 ± 14d 67 ± 6d 142 ± 4.3e 37.0 ± 1.5d
N340 14530 ± 332c 439 ± 10b 33.1 ± 0.9bc 285 ± 9d 45.2 ± 2.5a 535 ± 10e 81 ± 4e 170 ± 4.2f 39.9 ± 1.2d
F-test value
68.0** 4.6* 28.0** 96.7** 5.1* 415.7** 121.7** 365.0** 101.7**
Mean N0 10,470 ± 1330a 396 ± 16a 26.6 ± 4.1a 142 ± 17a – 159 ± 45a 15 ± 2a 45 ± 11a –
N140 13,837 ± 659b 408 ± 16ab 34.0 ± 2.5b 218 ± 13b 54.1 ± 4.9b 170 ± 51a 30 ± 5b 57 ± 14a 8.6 ± 2.9a
N190 15,022 ± 499c 417 ± 18ab 36.1 ± 2.2c 255 ± 15c 59.5 ± 4.7c 211 ± 35a 36 ± 5b 71 ± 11b 13.3 ± 2.3a
N240 16,098 ± 387d 426 ± 21ab 37.9 ± 2.2c 291 ± 16d 62.0 ± 2.4c 321 ± 13b 47 ± 3c 103 ± 5c 23.9 ± 4.7b
N290 15,750 ± 446 cd 433 ± 19b 36.5 ± 2.4c 313 ± 23d 58.9 ± 3.5c 429 ± 25c 62 ± 7d 136 ± 7d 31.1 ± 6.0c
N340 14,852 ± 419c 424 ± 18ab 35.2 ± 2.2bc 299 ± 16d 46.0 ± 2a 510 ± 27d 79 ± 5e 164 ± 7e 34.9 ± 5.0c
F-test value
42.4** 2.7* 11.4** 72.3** 17.8** 86.0** 128.4** 113.1** 32.8**
![]()
![]()
1 Different lowercase letters in the same column indicate significance (p < 0.05), while the same letter indicates non-significance.
2 WUE – water use efficiency, NRE – N recovery efficiency of plant, Soil-NRR – soil N relative residue rate.
3 * Indicates significance at p < 0.05 level, while ** indicates significance at p < 0.01 level.
4 Data of maize yield, NA, NRE and NO–3–N from Wang et al. (2018).
![]()
![]()
![]()
![]()
![]()
![]()
![]()
![]()
Fig. 6. Maize yield, NRE, WUE and Soil-NRR as related to the N application amount. 1 NRE – N recovery efficiency of plant, WUE – water use efficiency, Soil-NRR –
soil N relative residue rate. 2 ** indicates significance (p < 0.01) through F test. 3 The local market prices of N fertilizer and maize grain are 0.46 and 0.28 $⋅kg—1, respectively.
![]()
![]()
(Fig. 5). It concluded that overuse of N input would promote the movement of NO–3–N toward deeper soil layers, increasing additional risk of N leaching losses from the system, especially during irrigation or
rainfall events (Guo et al., 2008). In addition, excessive amounts of nutrients perhaps cause oxygen depletion in the soil and thus prevent the proper functioning of natural microorganisms, which in turn affects soil fertility (Hirel et al., 2011).
4.3. Appropriate N application under M-DF improves maize yield, water and N use efficiency
Nitrogen availability can affect crop photosynthetic rate, radiation interception, and plant growth, which in turn influence crop ETC. As reported by Pandey et al. (2000) and Lenka et al. (2009), greater N fertilizer input increased crop water use. Maize ETC increased when the
N application amount ranged from 0 to 290 kg⋅ha—1 in this study. The
WUE and NRE were affected by crop yield, ETC and plant NA. The results showed that all of maize yield, WUE, and NRE increased first and then decreased with the increase in N amount, and the peak values appeared in N240 treatments. It can be concluded that maize growth and resource use efficiency responded positively to an increase in the amount of N application until the optimal level had been reached. Further increase in N amount was unlikely to be as effective at increasing yields and resource use efficiency (Fig. 6) because of the theory of diminishing returns in agriculture (Tilman et al., 2002; Dai et al., 2019).
Identifying the optimal N application amount based on the function equations such as yield vs. N amount, WUE vs. N amount, and NRE vs. N amount is one of the most effective field test methods, as it takes into account both yield and environmental benefits and has abroad appli- cation in agriculture (Zhu, 2006; Zhang et al., 2018). If we take the three corresponding N application amounts which corresponded the optimal economic yield and the maximum WUE and NRE as the interval boundary, the range of the function values of each equation in this in- terval maintained at high levels around the extreme points with less than
5.0% reduction. Therefore, it’s feasible to recommend this interval of 226–253 kg⋅ha—1 as N input threshold under M-DF for maize, which can
ensure high benefits of maize production as well as lower soil N residue. Compared with the N fertilizer application threshold of
240–253 kg⋅ha—1 which was put forward according to the relationship
between yield benefit and N amount in previous research (Wang et al., 2018), this study decreased the lower limit of the reasonable N input threshold, which put more emphasis on the efficiency of resource uti- lization and environmental friendliness. In recent years, some other scholars have also carried out experiments on N fertigation management using M-DF for maize planting in northeast China. Lv (2012) and Hou et al. (2019) recommended the optimal N rate for maize with a planting
density of 75000–80000 plants⋅ha—1 under M-DF was 300 kg⋅ha—1, the
target yield was 15,532–15,739 kg⋅ha—1, and the N partial factor was 51.8–52.5 kg—1⋅kg—1. Maize yield (11,500–11,758 kg⋅ha—1) and WUE (24.8–25.2 kg—1⋅kg—1) of the optimal treatments conducted by C. Wang
et al. (2019) and Qi et al. (2019) were almost similar, but the recom- mended N rate for maize with 61,400–65,400 plants⋅ha—1 for planting density using M-DF were 292 and 240 kg⋅ha—1 respectively. The dif-
ferences in the findings drawn by these scholars above probably attributed to the differences in the planting densities of maize and fer- tigation frequencies, however, it has been proved that in-season N fer- tigation was better than that applied in two or three times, and appropriate close planting was better than wide-spacing planting for
maize. In this study, maize was planted with a density of 83,330 plants⋅ha—1, and the N fertilizer were applied in six times in maize
different growth stages, as a result, the recommended N rate under M-DF was obviously decreased, but the yield, WUE and N use efficiency were almost equal or improved, compared to the conclusions drawn by the above-mentioned researchers in the same region.
Identifying the optimal N application amount combined with the advanced water-saving technique mulched drip fertigation (M-DF) is the key method to ensure high maize productivity and small buildup of N residue in soil profile.
Appropriate N fertigation improved maize growth indexes, including plant height, stem diameter and LAI, which responded positively to grain yield. The in-season input of N fertilizer using M-DF increased plant NA during maize reproductive growth periods (from tasseling to maturity), which accounted for 42.7–50.7% of the total NA during the whole growing season across the treatments. The effect of N application amount on plant NA was more obvious after maize tasseling, which was mainly reflected in the differences in NA of ears.
The NA and NRE of plant, grain yield and WUE increased obviously when the N application amount ranged from 0 to 240 kg⋅ha–1, while the increasing rate of the indexes mentioned above decreased until negative
values appeared with further increase in N amount. The N residue in soil profile, especially in deeper layers (below 80 cm), noticeably increased when the N application amount exceeded 290 kg⋅ha–1. Based on the
function equations describing the relationships of yield, WUE, and NRE
with N application amount, the reasonable input threshold of 226–253 kg⋅ha–1 of N applied through in-season M-DF was recom-
mended for maize production would ensure high resources use effi- ciency but avoid large buildup of N residue in soil, which decreased the soil N residue rate by 12.2–16.0% points compared with that under
conventional N application amount of 340 kg⋅ha–1 in local field.
Declaration of Competing Interest
The authors declare that no financial interests or personal relation- ships is considered a potential competitive advantage.
The authors are grateful for financial assistance from the National Support Program of China (2016YFC0400105) and the Intelligent Agricultural Machinery Program of China (2017YFD0701404–2).
Al-Said, F.A., Ashfaq, M., Al-barhi, M., Hanjra, M.A., Khan, I.A., 2012. Water productivity of vegetables under modern irrigation methods in Oman. Irrig. Drain. 61, 477–489.
Barker, A.V., Maynard, D.N., Mills, H.A., 1974. Variations in nitrate accumulation among spinach cultivars. J. Am. Soc. Hortic. Sci. 99, 32–134.
Cassman, K.G., 1999. Ecological intensification of cereal production systems: yield potential, soil quality, and precision agriculture. Proc. Natl. Acad. Sci. U.S.A. 96, 5952–5959.
![]() Chifeng Agriculture and Animal Husbandry Bureau, Prices of agricultural means of production and agricultural products, 2015–2016. http://nmj.chifeng.gov.cn/ .
Chifeng Agriculture and Animal Husbandry Bureau, Prices of agricultural means of production and agricultural products, 2015–2016. http://nmj.chifeng.gov.cn/ .
Chukalla, A.D., Krol, M.S., Hoekstra, A.Y., 2015. Green and blue water footprint reduction in irrigated agriculture: effect of irrigation techniques, irrigation strategies and mulching. Hydrol. Earth Syst. Sci. 19, 4877–4891.
Dai, Z., Fei, L., Huang, D., Zeng, J., Chen, L., Cai, Y., 2019. Coupling effects of irrigation and nitrogen levels on yield, water and nitrogen use efficiency of surge-root irrigated jujube in a semiarid region. Agric. Water Manag. 213, 146–154.
Dordas, C.A., Sioulas, C., 2008. Safflower yield, chlorophyll content, photosynthesis, and water use efficiency response to nitrogen fertilization under rainfed conditions. Ind. Crop. Prod. 27, 75–85.
Elia, A., Conversa, G., 2012. Agronomic and physiological responses of a tomato crop to nitrogen input. Eur. J. Agron. 40, 64–74.
FAO, 2011. Internet Version. Food and agricultural organization of the United Nations, Rome.
Gao, B., Li, J., Zhou, Y., Zhao, L., 2000. Study of the law of nitrogen-phosphate-
potassium fertilizer absorption of 13.7–15.9 t/hm2 yield with different varieties of spring maize on the irrigated plain in Inner Mongolia. J. Inn. Mong. Agric. Univ. 21, 62–71.
Guo, J., Zhao, C., Meng, Z., Wang, X., Ma, W., 2008. The effect of nitrogen on nitrate leaching and absorption under spring corn in dry arears of north China. Chin. J. Soil Sci. 39 (3), 562–565.
He, P., Jin, J., Lin, B., 1998. Effect of N application rates on leaf senescence and its mechanism in spring maize. Sci. Agric. Sin. 31 (3), 66–71.
![]()
![]()
![]()
Heffer, P., Gru`ere, A., Roberts, T., 2017. Assessment of Fertilizer Use by Crop at the Global Level 2014–2014/15. International Fertilizer Association and International Plant Nutrition Institute.
Hirel, B., T´etu, T., Lea, P.J., Dubois, F., 2011. Improving nitrogen use efficiency in crops for sustainable agriculture. Sustainability 3, 1452–1485.
Hou, Y., Kong, L., Cai, H., Liu, H., Gao, Y., Wang, Y., Wang, L., 2019. The accumulation and distribution characteristics on dry matter and nutrients of high-yielding Maize under drip irrigation and fertilization conditions in semi-arid region of northeastern China. Sci. Agric. Sin. 52 (20), 3559–3572.
Kang, J., 2014. The Effects of Maize Growth under Mulched Drip Irrigation in the Northeast Inner Mongolia Region. China Agricultural University, Beijing.
Karandisha, F., Sˇimůnek, J., 2017. Two-dimensional modeling of nitrogen and water
dynamics for various N-managed water-saving irrigation strategies using HYDRUS. Agric. Water Manag. 193, 174–190.
King, B.J., Siddiqi, M.Y., Glass, A.D.M., 1992. Studies of the uptake of nitrate in barley.
I. Estimation of root cytoplasmatic nitrate concentration using reductase-activity –
implications for nitrate influx. Plant Physiol. 99, 1582–1589.
Lamb, J., Randall, G., Rehm, G., Rosen, C., 2008. Best Management Practices for Nitrogen Use in Minnesota. Publications in University of Minnesota Extension, 08560.
Lamm, F.R., Schlegel, A.J., 2004. Development of a best management practice for nitrogen fertigation of corn using SDI. Appl. Eng. Agric. 20 (2), 211–222.
Lassaletta, L., Billen, G., Grizzetti, B., Anglade, J., Garnier, J., 2014. 50 year trends in nitrogen use efficiency of world cropping systems: the relationship between yield and nitrogen input to cropland. Environ. Res. Lett. 9 (10), 105011.
Lea, P.J., Miflin, B.J., 2011. Chapter 1: nitrogen assimilation and its relevance to crop improvement. Annu. Plant Rev. 42, 1–40.
Leghari, S.J., Wahocho, N.A., Laghari, G.M., Laghari, A.H., Bhabhan, G.M., Talpur, K.H., Bhutto, T.A., Wahocho, S.A., Lashari, A.A., 2016. Role of nitrogen for plant growth and development: a review. Adv. Environ. Biol. 10, 209–218.
Lenka, S., Singh, A.K., Lenka, N.K., 2009. Water and nitrogen interaction on soil profile water extraction and ET in maize–wheat cropping system. Agric. Water Manag. 96, 195–207.
Li, F., Ma, Y., 2018. Regulation of photosynthesis and transpiration of summer maize under different nitrogen treatments. Agric. Res. Arid Areas 36, 102–109.
Li, J., Li, Y., Wang, J., Wang, Z., Zhao, W., 2016. Microirrigation in China: history, current situation and prospects. Shuili Xuebao 47 (3), 372–381.
Li, X., Sˇimůnek, J., Shi, H., Yan, J., Peng, Z., Gong, X., 2017. Spatial distribution of soil
water, soil temperature, and plant roots in a drip-irrigated intercropping field with plastic mulch. Eur. J. Agron. 83, 47–56.
Lin, B., Zhang, R., Gao, Y., Zhang, S., 2019. Development and countermeasures of high- efficiency water saving technology in Northwest China. Water Res. Plan. Design 03, 29–33.
Liu, L., Li, C., Sun, H., Lu, W., Feng, L., 2007. Physiological effects of nitrogen nutrition on the senescence of cotton leaves at different positions. Plant Nutr. Fertil. Sci. 13 (5), 910–914.
Liu, Y., Li, Y., Li, J., 2014. Effects of nitrogen management on the growth and yield of mulched and drip-irrigated maize in Northeast Black Soil Regions. Shuili Xuebao 45, 529–536.
Lv, S., 2012. Study on Different Nitrogen Application Schemes under Fertigation for Maize (Zea mays L.). Chinese Academy of Agricultural Sciences, Beijing.
Ma, S., Wang, Q., Wang, C., Huo, Z., 2008. The risk division on climate and economic loss of maize chilling damage in Northeast China. Geogr. Res. 27, 1169–1177.
Maresma, A´., Martínez-Casasnovas, J.A., Santiveri, F., Lloveras, J., 2019. Nitrogen
management in double-annual cropping system (barley-maize) under irrigated Mediterranean environments. Eur. J. Agron. 103, 98–107.
Mckee, G.W., 1964. A coefficient for computing leaf area in hybrid corn. Agron. J. 56, 240–241.
Mpanga, I.K., Idowu, O.J., 2020. A Decade of irrigation water use trends in Southwestern USA: The role of irrigation technology, best management practices, and outreach education programs. Agric. Water Manag. 243, 106438.
Ning, S., Shi, Z.B., Wang, J.C., Q.J, 2020. Soil water/salt balance and water productivity of typical irrigation schedules for cotton under film mulched drip irrigation in northern Xinjiang. Agric. Water Manag. 245, 106651.
Pandey, R.K., Maranville, J.W., Admou, A., 2000. Deficit irrigation and nitrogen effects on maize in a Sahelian environment I. Grain yield and yield components. Agric.
Qi, Y., Shi, H., Li, R., Zhao, J., Li, B., Li, M., 2019. Effects of film mulching on maize growth and soil water, fertilizer and heat under fertigation of drip irrigation. Trans. CSAE 35 (5), 99–110 (in Chinese with English abstract).
Rashidi, M., Keshavarzpour, F., 2011. Effect of different irrigation methods on crop yield and yield components of cantaloupe in the arid lands of Iran. World Appl. Sci. J. 15, 873–876.
Rudnicka, D.R., Irmak, S., Sharma, K., D.V, 2017. Impact of irrigation and nitrogen fertilizer rate on soil water trends and maize evapotranspiration during the vegetative and reproductive periods. Agric. Water Manag. 191, 77–84.
Sinha, I., Buttar, G.S., Brar, A.S., 2017. Drip irrigation and fertigation improve economics, water and energy productivity of spring sunflower (Helianthus annuus L.) in Indian Punjab. Agric. Water Manag. 185, 58–64.
Styer, R.C., 2009. Death of a Seedling Tip Burn, Abortion and Stunted Growth.
Sui, J., Wang, J., Gong, S., Xu, D., Zhang, Y., Qin, Q., 2018. Assessment of maize yield- increasing potential and optimum N level under mulched drip irrigation in the Northeast of China. Field Crop Res. 215, 132–139.
Sun, C., Zhou, H., Chen, L., Shen, Z., Wang, H., Liu, H., 2018. Pollution grade assessment of nitrogen leaching from farmland fertilizer in three northeastern provinces.
J. Agric. Resour. Environ. 35, 405–411.
Tilman, D., Balzer, C., Hill, J., Befort, B., 2011. Global food demand and the sustainable intensification of agriculture. Proc. Natl. Acad. Sci. U.S.A. 108, 20260–20264.
Tilman, D., Cassman, K.G., Matson, P.A., Naylor, R., Polasky, S., 2002. Agricultural sustainability and intensive production practices. Nature. 418, 671–677.
Uhart, S.A., Andrade, F.H., 1995. Nitrogen deficiency in maize I. Effects on crop growth, development, dry matter partitioning, and kernel set. Crop Sci. 35, 1376–1383.
Uzbek, M., 2013. The Cultivation Pattern of Maize Matching to Trickle Irrigation in the Chifeng Region. China Agricultural University, Beijing.
Vitousek, P.M., Aber, J.D., Howarth, R.W., Likens, G.E., Matson, P.A., Schineler, D.W., Schlesinger, W.H., Tilman, D.G., 1997. Human alteration of the global nitrogen cycle sources and consequences. Ecol. Appl. 7, 737–750.
Wang, C., Zhang, Y., Wang, J., Xu, D., Gong, S., Wu, Z., 2019a. Photosynthetic response of water-saving and yield-increasing of mulched drip irrigation for spring maize (Zea mays L.) in northeast China. Trans. CSAE 35 (24), 90–97.
Wang, D., Li, G., Mo, Y., Cai, M., Bian, X., 2018. Evaluation of optimal nitrogen rate for corn production under mulched drip fertigation and economic benefits. Field Crop. Res. 216, 225–233.
Wang, H., Li, J., Cheng, M., Zhang, F., Wang, X., Fan, J., Wu, L., Fang, D., Zou, H., Xiang, Y., 2019b. Optimal drip fertigation management improves yield, quality, water and nitrogen use efficiency of greenhouse cucumber. Sci. Hortic. 243, 357–366.
Wang, Y., Zhang, X., Chen, J., Chen, A., Wang, L., Guo, X., Niu, Y., Liu, S., Mi, G., Gao, Q., 2019c. Reducing basal nitrogen rate to improve maize seedling growth, water and nitrogen use efficiencies under drought stress by optimizing root morphology and distribution. Agric. Water Manag. 212, 328–337.
Wu, Y., Yan, S., Fan, J., Zhang, F., Xiang, Y., Zheng, J., Guo, J., 2021. Responses of growth, fruit yield, quality and water productivity of greenhouse tomato to deficit drip irrigation. Sci. Horticult. 275, 109710.
Xu, G., Lu, D., Liu, C., Wang, H., Chen, M., Li, Y., 2018. Effect of alternate wetting and drying irrigation and nitrogen coupling on endogenous hormones, nitrogen utilization. Trans. CSAE 34, 137–146.
Xu, H., 2014. The Cultivation Pattern of Maize Matching to Mulched Trickle Irrigation in the Region of Chifeng, Inner Mongolia. China Agricultural University, Beijing.
Yang, Q., Zhang, F., Li, F., 2011. Effect of different drip irrigation methods and fertilization on growth, physiology and water use of young apple tree. Sci. Hortic. 129, 119–126.
Yuan, J., 2015. The Effects of Different Subsurface Drip Tape Types and Irrigation Scheduling on Maize Growth. China Agricultural University, Beijing.
Zhang, F., Cui, Z., Chen, X., Ju, X., Shen, J., Chen, Q., Liu, X., Zhang, W., Mi, G., Fan, M., Jiang, R., 2012. Chapter one- Integrated nutrient management for food security and environmental quality in China. Adv. Agron. 116, 1–40.
Zhang, G., Liu, C., Xiao, C., Xie, R., Ming, B., Hou, P., Liu, G., Xu, W., Shen, D., Wang, K., Li, S., 2017. Optimizing water use efficiency and economic return of super high yield spring maize under drip irrigation and plastic mulching in arid areas of China. Field Crop. Res. 211, 137–146.
Zhang, J., Zhao, P., Pan, Z., Yu, D., Li, H., Wang, B., Jing, Y., Dong, Z., 2016.
Determination of input threshold of nitrogen fertilizer based on environment- friendly agriculture and maize yield. Trans. CSAE 32, 1002–6819.
Zhang, X., Wang, Y., Chen, J., Chen, A., Wang, L., Guo, X., Niu, Y., Zhang, X., Chen, L., Gao, Q., 2019. Effects of soil water and nitrogen on plant growth, root morphology and spatial distribution of maize at the seedling stage. Sci. Agric. Sin. 52, 34–44.
Zhang, Y., Wang, H., Lei, Q., Zhang, J., Zhai, L., Ren, T., Liu, H., 2018. Recommended methods for optimal nitrogen application rate. Sci. Agric. Sin. 51, 2937–2947.
Zhou, L., Feng, H., Zhao, Y., Qi, Z., Zhang, T., He, J., Dyck, M., 2017. Drip irrigation lateral spacing and mulching affects the wetting pattern shoot-root regulation, and yield of maize in a sand-layered soil. Agric. Water Manag. 184, 114–123.
Zhou, L., He, J., Qi, Z., Dyck, M., Zou, Y., Zhang, T., Feng, H., 2018. Effects of lateral spacing for drip irrigation and mulching on the distributions of soil water and nitrate, maize yield, and water use efficiency. Agric. Water Manag. 199, 190–200.
Zou, H., Fan, J., Zhang, F., Xiang, Y., Wu, L., Yan, S., 2020. Optimization of drip irrigation and fertilization regimes for high grain yield, crop water productivity and economic benefits of spring maize in Northwest China. Agric. Water Manag. 230, 105986.
Zhu, Z., 2006. On the methodology of recommendation for the application rate of chemical fertilizer nitrogen to crops. Plant Nutr. Fertil. Sci. 12, 1–4 (in Chinese with English abstract).
![]()