
Crop water and nitrogen productivity in response to long-term diversified

![]()

 Agricultural Water Management 257 (2021) 107149
![]()
Crop water and nitrogen productivity in response to long-term diversified ![]() crop rotations and management systems
crop rotations and management systems
Upendra M. Sainju a,*, Andrew W. Lenssen b, Brett L. Allen a, Jalal D. Jabro a, William B. Stevens a
a USDA, Agricultural Research Service, Northern Plains Agricultural Research Laboratory, Sidney, MT, USA
b Agronomy Department, Iowa State University, Ames, IA, USA
![]()
A R T I C L E I N F O
![]() Handling Editor: Dr R Thompson
Handling Editor: Dr R Thompson
![]() Keywords: Cropping sequence Crop yield Evapotranspiration
Keywords: Cropping sequence Crop yield Evapotranspiration
Management practices Nitrogen-use efficiency Water-use efficiency
A B S T R A C T
![]()
Diversified crop rotation and management strategies may affect crop water and N productivity. We studied the effect of tillage, crop rotation, and management system on pre-plant and postharvest soil water storage, annu- alized crop yield, water use, and water and N productivity from 2005 to 2010 in the northern Great Plains, USA. Tillage were conventional tillage and no-tillage; crop rotations were continuous spring wheat (Triticum aestivum L.) (CW), spring wheat-pea (Pisum sativum L.) (WP), spring wheat-forage barley (Hordeum vulgare L.)-pea (WBP), and spring wheat-forage barley-corn (Zea mays L.)-pea (WBCP). Managements were traditional (a combination of recommended seeding rate, broadcast N fertilization, early planting, and short stubble height) and alternate (a combination of increased seeding rate, banded N fertilization, late planting, and tall stubble height) systems. Aboveground biomass was 16–85%, preplant soil water 23–118%, postharvest soil water 38–246%, and water productivity 28–61% greater with WBCP than CW in 3 out of 6 yr. Crop water use and biomass N accumulation varied with tillage, crop rotations, and management systems in various years. Grain yield was 26–41% and grain water productivity 25–32% lower with WBP than other crop rotations. Grain N accumulation was 20–52%, grain N productivity 23–60%, and grain and biomass N removal indices 18–153% greater with WP than CW and WBCP, but biomass N productivity was 98–110% lower with CW than other crop rotations. Diversified crop rotation with longer rotation length increased crop yield, soil water storage, and water productivity, but shorter rotation with legume increased grain and biomass N productivity and N removal.
![]()
Performance of dryland crops in arid and semiarid regions is affected by soil water and N availability (Miller et al., 2003; Lenssen et al., 2014; Sainju et al., 2019). In the semiarid northern Great Plains, USA, limited precipitation and a short growing season present major challenges for sustainable crop production. Crops can sometime fail due to the erratic nature of precipitation, resulting in a substantial loss of producers’ farm income (Major et al., 1991; Nielsen et al., 2010). Because dryland crop production depends on soil water storage at planting and precipitation during the growing season as long as nutrients are not limited, water from precipitation should be properly captured, stored in the soil, and used efficiently by crops (Unger et al., 2006; Nielsen et al., 2010). To reduce the negative consequences of excessive N fertilization on soil and
environmental quality, improved management techniques are needed to reduce N fertilization rates without compromising crop yields. As a result, both soil water and N should be efficiently used to sustain dryland crop yields and meet food demand for the growing population (Unger et al., 2006; Nielsen et al., 2010; Lenssen et al., 2014).
In the northern Great Plains, alternate year crop-fallow rotation and continuous monocropping are conventional cropping systems still practiced by many producers. Crop-fallow reduces annualized crop yield and soil organic matter compared to continuous monocropping, which reduces yield compared to crop rotation due to increased disease and pest infections (Farahani et al., 1998; Johnston et al., 2002; Sainju et al., 2009). Diversified crop rotations that include cereals, pulses, and for- ages can increase crop yields compared to continuous monocropping by efficiently using soil water (Lenssen et al., 2014, 2018a, 2018b; Schlegel
![]()
Abbreviations: BNP, aboveground biomass N productivity; BNRI, aboveground biomass N removal index; BWP, aboveground biomass water productivity; CW, continuous spring wheat; GNP, grain N productivity; GNRI, grain N removal index; GWP, grain water productivity; WBP, spring wheat-forage-barley-pea; WBCP, spring wheat-forage barley-corn-pea; W-P, spring wheat-pea.
* Corresponding author.
E-mail address: upendra.sainju@usda.gov (U.M. Sainju).
https://doi.org/10.1016/j.agwat.2021.107149
Received 28 July 2020; Received in revised form 23 August 2021; Accepted 24 August 2021
Available online 2 September 2021
0378-3774/Published by Elsevier B.V.
![]()
![]()
et al., 2017, 2019). The sequence of crops in diversified crop rotations are arranged in such a way that low water requirement and N supplying crops are followed by high water and N requirement crops (Unger et al., 2006; Lenssen et al., 2014). For example, spring wheat and corn are high water and N demanding crops, while pea and forage barley are low water and N demanding crops (Miller et al., 2003; Lenssen et al., 2018b). The N fixing and N supplying ability of pea residue can reduce N fertilization rate to succeeding crops (Miller et al., 2003; Lenssen et al., 2018b). Sequencing cool and warm season crops in the rotation can also efficiently utilize soil water and control weeds (Anderson, 2005; Lenssen and Cash, 2011). Several researchers (Lenssen et al., 2018a; Schlegel et al., 2017) have reported that soil water storage, crop yield, and water-use efficiency were greater with diversified crop rotations than monocropping. Diversified cropping systems not only reduce farm in- puts, but also sustain dryland crop yields and enhance producers’ farm income (Singer and Cox, 1998; Katsvairo and Cox, 2000).
Tillage has a variable effect on dryland crop yield, water use, and water- and N-use efficiency. No-tillage enhances dryland crop yields by increasing soil water storage and water-use efficiency compared to conventional tillage by reducing evaporation and increasing infiltration capacity (Hatfield et al., 2001; Nielsen et al., 2005). Lenssen et al. (2014, 2015) observed that no-tillage increased dryland spring wheat yield and water-use efficiency compared to conventional tillage during dry years, but tillage had a variable effect on forage barley yield and water-use efficiency in various years. Numerous researchers (Payne et al., 2001; Machado et al., 2008; Lenssen et al., 2018a) reported no effect of tillage on pea yield, but others (Lafond et al., 2006; Ruisi et al., 2012) found increased pea yield with no-tillage compared to conventional tillage. Dryland corn yield was greater (DeFelice et al., 2006; Lenssen et al., 2018b) or lower (Vetsch and Randall, 2002) in no-tillage than conven- tional tillage, or not affected by tillage (Meyer-Aurich et al., 2006). Allen et al. (2016) reported that tillage had no effect on forage barley yield and N-use efficiency.
Other management options, such as seeding rate, stubble height, method of N fertilization and planting and harvest dates, can affect crop yield and water use (Anderson, 1999; Lenssen et al., 2014). Increased seeding rate can increase water-use efficiency by controlling weed growth and enhancing crop water uptake due to increased plant density (Tompkins et al., 1991). Tall stubble can increase soil water storage by trapping snow and reducing soil temperature, wind speed, and evapo- ration compared to short or no stubble (Nielsen et al., 2005; Unger et al., 2006). Some researchers (Black and Siddoway, 1977; Aase and Siddo- way, 1980) in the northern Great Plains have found that a stubble height of 30–38 cm increased soil water storage at the 0–20 cm depth by 28–40 mm compared to the stubble incorporated into the soil through tillage. Banded N fertilization can limit N availability to weeds and delayed planting after late application of pre-plant herbicide can kill weed seedlings (Nichols et al., 2015; Strydhorst et al., 2008).
Because of the reduction in crop yields due to conventional cropping systems, improved management strategies are needed to enhance soil water storage, yields, water use, and water-use efficiency in the northern Great Plains. We evaluated the effect of diversified crop rotation, tillage, and management system that included a combination of seeding rate, date of planting, method of N fertilization, and stubble height on pre- plant and postharvest soil water storage, annualized crop yield, water use, and water and N productivity (or water- and N-use efficiency) from 2005 to 2010 in the northern Great Plains, USA. Our objectives were to:
(1) examine how tillage, crop rotation, and management system affect soil water storage, crop yield, water use, and water and N productivity, and (2) determine which management strategies can enhance crop yield and water and N productivity. We hypothesized that no-tillage, diver- sified crop rotation, and the alternate management system would in- crease crop yield, water use, and water and N productivity compared to conventional tillage, continuous monocropping, and the traditional management system.
2.1. Field site and treatments
The field site was located 8 km northwest of Sidney, Montana, USA (47◦ 46′ N, 104◦ 16′ W, 690 m elevation). Soil at the site was a Williams
loam (fine-loamy, mixed, superactive, frigid Typic Argiustolls) with 350 g kg—1 sand, 325 g kg—1 silt, 325 g kg—1 clay, 6.1 pH, 12 mg kg—1 Olsen-P
concentration, and 18 g kg—1 organic matter at the 0–15 cm depth. Long-
term (30-yr) mean annual precipitation at the site is 340 mm, with about 80% occurring during the crop growing season from April through September. Prior to the initiation of this study, the site had been in a cereal-fallow rotation under fall and spring tillage for several decades. The long-term dryland field study was conducted from 2004 to 2010 comparing four crop rotations in two tillage and two management sys- tems. The experimental design was a randomized complete block in a split-plot arrangement. Tillage system was the main-plot factor and included no-tillage and conventional tillage. The conventional tillage included a single pass tillage to a depth of 8 cm with a field cultivator equipped with C-shanks attached with 45-cm wide sweeps and coil- tooth spring harrows and 60 cm bars. The split-plot factor was a facto- rial arrangement of management system and crop rotation. Crop rota- tions were continuous spring wheat (CW), spring wheat-pea (WP), spring wheat-forage barley-pea (WBP), and spring wheat-forage barley- corn-pea (WBCP), with each phase of the rotation present in every year. Management systems were traditional and alternate practices, which varied by crop (Table 1). Traditional management practice included a combination of recommended seeding rate, broadcast N fertilization for spring wheat, forage barley, and corn, early planting, and short stubble height for spring wheat. Alternate management practice included a combination of increased seeding rate, banded N fertilization for spring wheat, pea, and forage barley, late planting, and tall stubble height for spring wheat. Individual split plot size was 12.2 m by 12.2 m. There
were three replicates of each treatment.
2.2. Crop management
At planting, spring wheat, forage barley, pea, and corn received recommended N fertilization rates (Table 1). Nitrogen fertilizer as urea and monoammonium phosphate was applied to all crops, except pea which received N from monoammonium phosphate. Urea was broadcast to spring wheat, forage barley, and corn in the traditional management system, and banded to spring wheat and forage barley in the alternate system. Nitrogen requirements to all crops, except pea, were adjusted for residual soil NO3-N content in samples to a depth of 60 cm collected in the autumn of the previous year. Therefore, available N included both soil and fertilizer N. This was done to avoid excessive N application.
Phosphorus fertilizer as monoammonium phosphate was banded at 13 kg P ha—1 and K fertilizer as muriate of potash was banded at 22 kg K ha—1 to all crops at planting. Fertilizers were banded at 5 cm below and
to the side of the seed row.
Spring wheat (cultivar Reeder), forage barley (cultivar Haybet), and pea (cultivar Majoret) were planted with a 3.1-m wide drill at a row spacing of 20.3 cm. The drill was equipped with double-shoot Barton (http://www.flexicoil.com/barton.asp) disk openers for low distur- bance single-pass seeding and fertilization. Immediately following planting, barley and pea plots were land rolled to push rocks back into the soil and protect the harvesting equipment (Saskatchewan Pulse Growers, 2000). The roller, weighing 2415 kg, consisted of a 1.1 m diameter by 3.1 m width metal cylinder attached to a carriage frame. Corn (cultivar Pioneer Hybrid 39T67-RR for 2005–2008 and 39D95-RR for 2009–2010) was planted with a John Deere 1700 Max Emerge Plus planter (Deere and Co., Moline, IL) at a spacing of 60 cm. Herbicides and pesticides were applied before crop planting, during growth, and after harvest as needed. Crops were grown under dryland conditions without irrigation.
![]()
![]()
![]()
![]() Management systems applied to crops in all rotations.
Management systems applied to crops in all rotations.
Alternate 2.98 Banded 101 Early May 30
Pea Traditional 0.60 Banded 6 Early April 5
Alternate 0.92 Banded 6 Early April 5
Forage barley Traditional 2.23 Broadcast 67 Early April 5
Alternate 2.98 Banded 67 Early April 5
Corn Traditional 0.037a, 0.025b Broadcast 78 Early May 20
Alternate 0.048a, 0.025b Broadcast 78 Early May 20
![]() a Seeding rate from 2004 to 2007.
a Seeding rate from 2004 to 2007.
b Seeding rate from 2008 to 2010.
![]()
![]()
![]()
In mid- to late July, forage barley biomass yield was determined by hand clipping aboveground biomass from two 0.5 m2 quadrats per plot and oven drying at 65 ◦C for 3 d. Pea and spring wheat aboveground
biomass were similarly determined in late July to mid-August two days
before grain harvest. Pea and spring wheat grains were harvested using a self-propelled combine equipped with a 1.5-m header from an area of 15 m2. Grain yields were determined on an oven-dried basis after drying a
sample at 65 ◦C for 7 d. In September, corn was harvested by hand from
two 4-m rows (4.8 m2 area) and oven dried at 65 ◦C for 7 d to determine aboveground biomass. Corn grain was separated from stalks and cobs, cleaned, and weighed to determined grain yield. Stubble height for spring wheat in traditional and alternate management systems was maintained by using a combine at harvest. Annualized aboveground biomass and grain yield for a crop rotation was determined by averaging aboveground biomass and grain yields of crops within the rotation in a year (total aboveground biomass or grain yield / number of crops in a rotation).
2.3. Water and nitrogen productivity
Pre-plant and postharvest soil water storage to a depth of 120 cm were determined using a calibrated neutron attenuation probe (Chana- syk and Naeth, 1996). Crop water use (Hatfield et al., 2001; Lenssen et al., 2014, 2015) was calculated as:
Water use = Pre-plant soil water + Growing season precipitation – Postharvest soil water (1)
Precipitation was measured from a weather station located about 50 m from the study site. The growing season precipitation (April to September) for each crop was calculated by adding daily total precipi- tation from planting to harvest, assuming that water lost through surface
runoff and deep percolation were negligible, as slope of the land at the experimental site was < 2% and precipitation is lower than evapo- transpiration (Farahani et al., 1998).
Water productivity for aboveground biomass and grain (Machado et al., 2008; Lenssen et al., 2014, 2015) was calculated as:
Aboveground biomass water productivity (BWP) = Aboveground biomass / water use (2)
Gain water productivity (GWP) = Grain yield / water use (3)
Nitrogen concentration in aboveground biomass and grain of crops was determined using a C and N analyzer (LECO, St. Joseph, MI) after grinding an oven-dried sample to 1 mm. Nitrogen accumulation in aboveground biomass and grain was calculated by multiplying above- ground biomass and grain yield by their N concentration. Aboveground biomass and grain N productivity (Singer and Cox, 1998; Allen et al., 2016) were calculated as:
Aboveground biomass N productivity (BNP) = Aboveground biomass / Available N (soil N + fertilizer N) (4)
Grain N productivity (GNP) Grain yield / Available N (soil N fertilizer N)
![]() (5)
(5)
Nitrogen recovery index (Singer and Cox, 1998; Allen et al., 2016) in aboveground biomass and grain was calculated as:
Aboveground biomass N recovery index (BNRI) = Aboveground biomass N accumulation / Available N (soil N + fertilizer N) (6)
Grain N recovery index (GNRI) = Grain N accumulation / Available N (soil N
+ fertilizer N) (7)
Pre-plant and postharvest soil water storage, water use, BWP, GWP, BNP, GNP, BNRI, and GNRI for a rotation system were calculated by averaging these parameters for all crops within a rotation in a year. For example, pre-plant soil water storage for WBCP was calculated by dividing total preplant soil water storage under spring wheat, forage barley, corn, and pea by 4, because the number of crops in the rotation was 4.
2.4. Statistical analysis
![]()
![]() Data were analyzed using the MIXED procedure of SAS (Statistical Analysis Systems, Version 9, Cary, NC) with appropriate error terms for a split plot analysis (Littell et al., 2006) after testing for normal distri- bution. Main plot treatment was tillage and split-plot treatment was a factorial combination of crop rotation and management system. Fixed effects were tillage, crop rotation, management system, year, and their interactions and random effects were replication and replication tillage interaction. Means were separated by using the least square means test (Littell et al., 2006) when significantly different at P 0.05. Data for 2004 were not included for analysis as it was considered a treatment establishment year.
Data were analyzed using the MIXED procedure of SAS (Statistical Analysis Systems, Version 9, Cary, NC) with appropriate error terms for a split plot analysis (Littell et al., 2006) after testing for normal distri- bution. Main plot treatment was tillage and split-plot treatment was a factorial combination of crop rotation and management system. Fixed effects were tillage, crop rotation, management system, year, and their interactions and random effects were replication and replication tillage interaction. Means were separated by using the least square means test (Littell et al., 2006) when significantly different at P 0.05. Data for 2004 were not included for analysis as it was considered a treatment establishment year.
3.1. Air temperature and precipitation
Monthly air temperature for April and June was lower in 2008 and 2009 than other years and the 30-yr average (Fig. 1). Air temperature for July was greater in 2006 and 2007 than other years and the 30-yr average. In September, air temperature was greater in 2009 than other years.
Monthly total precipitation for April, June, and September was greater in 2005 than other years and the 30-yr average (Fig. 1). In May, precipitation was greater in 2005, 2007, and 2009 than other years and the 30-yr average. The July and August precipitation were lower from 2005 to 2008 than other years. Growing season (April-September) pre- cipitation accounted for 78% of the annual (January-December) pre- cipitation and was lower in 2008 and higher in 2006 and 2010 than other years and the 30-yr average.
![]()
![]()
![]()
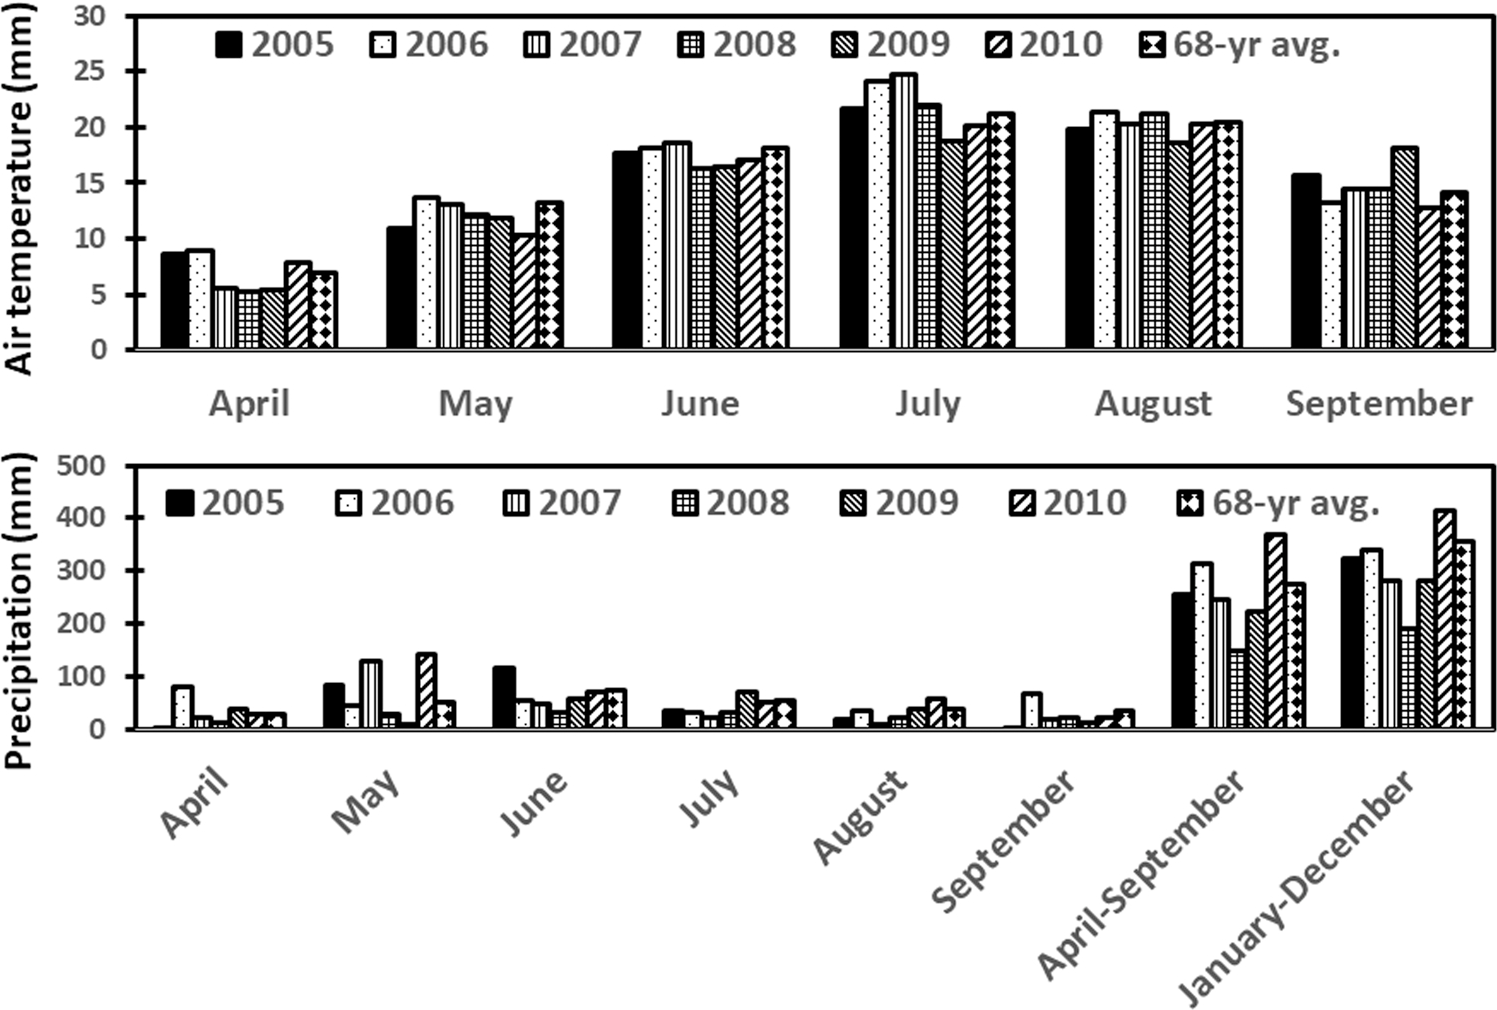
Fig. 1. Monthly mean air temperature and total precipitation from April to September at the study site. The growing season (April-September) and total annual (January-December) precipitation are also shown.
![]()
3.2. Annualized aboveground biomass and grain yield
![]() Crop rotation, year, and crop rotation year interaction were sig- nificant for annualized aboveground biomass (Table 2). Averaged across tillage and management systems, aboveground biomass was 21–33% greater with WBP and WBCP than CW and WP in 2005, 85% greater with WBCP than CW in 2008, and 20–29% greater with WBCP than WP and WBP in 2009 (Table 3). In 2010, aboveground biomass was 14–18% greater with WP and WBCP than CW and WBP. Tillage and management system did not influence aboveground biomass.
Crop rotation, year, and crop rotation year interaction were sig- nificant for annualized aboveground biomass (Table 2). Averaged across tillage and management systems, aboveground biomass was 21–33% greater with WBP and WBCP than CW and WP in 2005, 85% greater with WBCP than CW in 2008, and 20–29% greater with WBCP than WP and WBP in 2009 (Table 3). In 2010, aboveground biomass was 14–18% greater with WP and WBCP than CW and WBP. Tillage and management system did not influence aboveground biomass.
Annualized grain yield was significantly influenced by crop rotation, management system, and year, but tillage and treatment interactions were not significant (Table 2). Averaged across tillage, management systems, and years, grain yield was 26–41% greater with CW, WP, and WBCP than WBP (Table 4). Averaged across tillage, crop rotations, and years, grain yield was 14% greater with the traditional than the alternate management system. Averaged across treatments, grain yield was
greater in 2005 and 2010 than other years.
3.3. Pre-plant and postharvest soil water storage
![]() Pre-plant soil water storage varied with crop rotations, management systems, and years, with a significant crop rotation year interaction (Table 2). Averaged across tillage and management systems, pre-plant soil water was 28% - greater with CW than WBP in 2006 (Table 3). From 2007–2009, pre-plant soil water was 23–118% greater with WBCP than CW. In 2010, pre-plant soil water was 24–49% greater with CW than WP and WBP (Table 3). Averaged across tillage, crop rotations, and years, pre-plant soil water was 14% greater in the alternate than the traditional management system (Table 4). Tillage had no influence on pre-plant soil water.
Pre-plant soil water storage varied with crop rotations, management systems, and years, with a significant crop rotation year interaction (Table 2). Averaged across tillage and management systems, pre-plant soil water was 28% - greater with CW than WBP in 2006 (Table 3). From 2007–2009, pre-plant soil water was 23–118% greater with WBCP than CW. In 2010, pre-plant soil water was 24–49% greater with CW than WP and WBP (Table 3). Averaged across tillage, crop rotations, and years, pre-plant soil water was 14% greater in the alternate than the traditional management system (Table 4). Tillage had no influence on pre-plant soil water.
![]() Postharvest soil water storage varied with crop rotations and years, with a significant crop rotation year interaction, but tillage and management system were not significant (Table 2). Postharvest soil
Postharvest soil water storage varied with crop rotations and years, with a significant crop rotation year interaction, but tillage and management system were not significant (Table 2). Postharvest soil
![]() Analysis of variance for annualized aboveground biomass and grain yields, pre-plant and postharvest soil water storage, crop water use, grain water productivity (GWP), and aboveground biomass water productivity (BWP) with tillage (T), crop rotation (C), management system (M) and year (Y) as sources of variance.
Analysis of variance for annualized aboveground biomass and grain yields, pre-plant and postharvest soil water storage, crop water use, grain water productivity (GWP), and aboveground biomass water productivity (BWP) with tillage (T), crop rotation (C), management system (M) and year (Y) as sources of variance.
![]() Source Above-ground biomass (kg ha—1)
Source Above-ground biomass (kg ha—1)
![]() P values
P values
Grain yield (kg ha—1)
Pre-plant soil water storage (mm)
Postharvest soil water storage (mm)
Crop water use (mm)
GWP (kg ha—1 mm—1)
BWP (kg ha—1 mm—1)
![]()
![]()
T 0.361 0.578 0.338 0.438 0.865 0.570 0.269
C < 0.001 < 0.001 < 0.001 < 0.001 < 0.001 < 0.001 < 0.001
T × C 0.567 0.869 0.670 0.614 0.999 0.859 0.602
M 0.076 0.006 < 0.001 0.614 0.694 0.009 0.128
T × M 0.803 0.617 0.750 0.530 0.868 0.716 0.900
C × M 0.693 0.686 0.274 0.867 0.893 0.720 0.518
T × C × M 0.524 0.903 0.559 0.704 0.889 0.921 0.570
Y < 0.001 < 0.001 < 0.001 < 0.001 < 0.001 < 0.001 < 0.001
T × Y 0.476 0.934 0.771 0.723 0.989 0.953 0.536
C × Y < 0.001 0.448 < 0.001 < 0.001 < 0.001 0.006 < 0.001
T × C × Y 0.800 0.999 1.000 0.924 0.999 0.999 0.774
M × Y 0.068 0.534 0.225 0.320 0.012 0.578 0.137
T × M × Y 0.947 0.999 0.891 0.943 0.828 0.999 0.891
C × M × Y 0.994 1.000 0.997 0.926 0.999 1.000 0.991
T × C × M 0.998 1.000 0.996 0.982 0.988 1.000 0.994
× Y
![]()
![]()
![]()
![]() Interaction between crop rotation and year for annualized aboveground biomass and grain yields, pre-plant and postharvest soil water storage, crop water use, and aboveground biomass and grain water productivities.
Interaction between crop rotation and year for annualized aboveground biomass and grain yields, pre-plant and postharvest soil water storage, crop water use, and aboveground biomass and grain water productivities.
 Crop rotationa 2005 2006 2007 2008 2009 2010
122 131a 160b 44c 55b
32b 3c 40 3 28
WP 34b 16bc 33 8 26 30b
WBP 63a 35b 34 16 28 52ab
WBCP 82a 79a 32 22 35 54a
WP and WBP in 2006 and 80% greater with WBCP than WP in 2010.
3.4. Crop water use
![]() Crop water use varied with crop rotations and years, with significant interactions for crop rotation year and management system year (Table 2). Averaged across tillage and management systems, water use was 40–53% greater with CW and WP than WBP and WBCP in 2006 (Table 3). In 2007, water use was 23% greater with WBCP than CW. In 2010, water use was 24–49% greater with CW than WBP and WBCP. Averaged across tillage and crop rotations, water use was 17% greater with the alternate than the traditional management system in 2009 (Table 5). Tillage did not affect crop water use.
Crop water use varied with crop rotations and years, with significant interactions for crop rotation year and management system year (Table 2). Averaged across tillage and management systems, water use was 40–53% greater with CW and WP than WBP and WBCP in 2006 (Table 3). In 2007, water use was 23% greater with WBCP than CW. In 2010, water use was 24–49% greater with CW than WBP and WBCP. Averaged across tillage and crop rotations, water use was 17% greater with the alternate than the traditional management system in 2009 (Table 5). Tillage did not affect crop water use.
3.5. Water productivity
![]() Crop rotation, year, and crop rotation year interaction were sig- nificant for BWP, but treatment and management system were not sig-
Crop rotation, year, and crop rotation year interaction were sig- nificant for BWP, but treatment and management system were not sig-
![]()
Crop water use (mm)
CW 321 264a 299b 147 222 343a
WP 321 243a 328ab 171 227 326ab
nificant (Table 2). Averaged across tillage and management systems, BWP was 31–68% greater with WBP and WBCP than CW and WP in 2005
WBP 299 181b 325ab 158 200 289c
WBCP 294 173b 348a 173 220 308bc
Grain water productivity (GWP) (kg ha—1 mm—1)
CW 8.11 6.89b 7.84 2.48 11.60a 7.40
WP 7.98 8.25b 7.50 4.05 10.54a 8.65
WBP 6.27 8.38b 4.56 3.63 6.95b 5.76
WBCP 7.56 12.09a 4.80 3.35 9.42ab 7.83
Aboveground biomass water productivity (BWP) (kg ha—1 mm—1) CW 17.2b 27.8b 25.6 11.1b 27.7ab 19.2b WP 17.5b 24.7b 22.4 15.2ab 24.3b 23.0ab WBP 22.9a 39.8a 22.8 17.9a 26.2ab 22.3ab
WBCP 24.5a 41.4a 21.6 17.9a 29.6a 24.6a
Aboveground biomass N accumulation (kg N ha—1)
CW 55c 101 74 26 121 132b
WP 58bc 100 93 40 123 171a
and 2006 and 61% greater with WBP and WBCP than CW in 2008 (Table 3). In 2009, BWP was 22% greater with WBCP than WP. In 2010, BWP was 28% greater with WBCP than CW.
The GWP was influenced by crop rotation, management system, and year, with a significant crop rotation × year interaction (Table 2). Averaged across tillage and management systems, GWP was 44–75%
greater with WBCP than CW, WP, and WBP in 2006. In 2009, GWP was 52–67% greater with CW and WP than WBP (Table 3). Averaged across
Interaction between management system, crop rotation, tillage, and year for crop water use and aboveground biomass N accumulation.
WBP 85ab 99 100 48 105 138b
![]() WBCP 89a 92 90 49 120 146ab
WBCP 89a 92 90 49 120 146ab
Management systema
Tillageb 2005 2006 2007 2008 2009 2010
![]() a Crop rotations are CW, continuous spring wheat; WP, spring wheat-pea; WBP, spring wheat-forage barley-pea; and WBCP, spring wheat-forage barley-
a Crop rotations are CW, continuous spring wheat; WP, spring wheat-pea; WBP, spring wheat-forage barley-pea; and WBCP, spring wheat-forage barley-
Crop water use (mm)
Traditional 318 213 331 163 198bc
319
b Numbers followed by different letters within a column in a set are signifi- cantly different at P = 0.05 by the least square means test.
water, averaged across tillage and management systems, was 82–156% greater with WBP and WBCP than CW and WP in 2005 (Table 3). Postharvest soil water was also 333–344% greater with WBCP than CW,
Alternate 300 217 324 161 231a 314
Aboveground biomass N accumulation (kg N ha—1) CT 67b 94 95a 38 119 156a
NT 76a 102 83b 44 115 137b
![]()
a See Table 1 for the description of management systems.
b Tillage are CT, conventional tillage; and NT, no-tillage.
c Numbers followed by different letters within a column in a set are signifi- cantly different at P = 0.05 by the least square means test.
![]()
![]()
 Effect of crop rotation, management system, and year on annualized aboveground biomass and grain yields, pre-plant and postharvest soil water storage, crop water use, grain water productivity (GWP), and aboveground biomass water productivity (BWP).
Management systemc
Year
a Crop rotations are CW, continuous spring wheat; WP, spring wheat-pea; WBP, spring wheat-forage barley-pea; and WBCP, spring wheat-forage barley-corm-pea.
![]() b Numbers followed by different letters within a column in a set are significantly different at P 0.05 by the least square means test.
b Numbers followed by different letters within a column in a set are significantly different at P 0.05 by the least square means test.
c See Table 1 for the description of management systems.
![]()
![]()
![]()
tillage, crop rotations, and years, GWP was 14% greater with the traditional than the alternate management system (Table 4). Tillage had no effect on GWP.
3.6. Aboveground biomass and grain nitrogen accumulation
![]()
![]() Aboveground biomass N accumulation varied with crop rotations and years, with significant interactions for tillage year and crop rotation year (Table 6). Averaged across crop rotations and manage- ment systems, aboveground biomass N was 13% greater with no-tillage than conventional tillage in 2005, but was 12–13% greater with con- ventional tillage than no-tillage in 2007 and 2010 (Table 5). Averaged across tillage and management systems, aboveground biomass N was 53–62% greater with WBCP than CW and WP in 2005 (Table 3). In 2010, aboveground biomass N was 24–30% greater with WP than CW and WBP. Management system had no effect on aboveground biomass N.
Aboveground biomass N accumulation varied with crop rotations and years, with significant interactions for tillage year and crop rotation year (Table 6). Averaged across crop rotations and manage- ment systems, aboveground biomass N was 13% greater with no-tillage than conventional tillage in 2005, but was 12–13% greater with con- ventional tillage than no-tillage in 2007 and 2010 (Table 5). Averaged across tillage and management systems, aboveground biomass N was 53–62% greater with WBCP than CW and WP in 2005 (Table 3). In 2010, aboveground biomass N was 24–30% greater with WP than CW and WBP. Management system had no effect on aboveground biomass N.
Grain N accumulation varied with crop rotations and years, but tillage, management system, and their interaction were not significant (Table 6). Averaged across tillage, management systems, and years, grain N was 20–52% greater with WP than CW, WBP, and WBCP (Table 7). Averaged across treatments, grain N was greater in 2007 and 2009 than 2006, 2008, and 2010.
3.7. Nitrogen productivity and removal index
Crop rotation and year were significant for BNP, GNP, BNRI, and GNRI, but tillage, management system, and their interaction were not significant (Table 6). Averaged across tillage, management systems, and years, BNP was 98–111% greater with WP, WBP, and WBCP than CW (Table 7). The GNP was 23–115% greater and GNRI 41–139% greater with WP than CW, WBP, and WBCP. The BNRI was 18–154% greater with WP than CW and WBCP. Averaged across treatments, BNP was greater in 2007 than 2005, 2008, and 2009. The GNP was greater in
2010 than 2006 and 2008. The BNRI was greater in 2006, 2009, and
2010 than other years. The GNRI was greater in 2009 than 2006, 2008,
and 2010.
4.1. Crop yield
The greater annualized aboveground biomass with WP, WBP, and WBCP than CW in 2005 and 2010 (Table 3) when the growing season precipitation was near or above the 30-yr average (Fig. 1) was probably
due to soil water and N benefits of crop rotation compared to mono- cropping. In WP, WBP, and WBCP, lower water demanding crops, such as pea and forage barley, were followed by higher water demanding crops, such as spring wheat and corn, thereby increasing the amount of soil water available to succeeding crops and enhancing the overall yield of the rotation system. Pea matures 3–7 wk earlier than spring wheat and corn, thereby increasing water available to succeeding crops (Lenssen et al., 2018a). Furthermore, pea, being a legume, fixes N from the atmosphere, supplies N from its residue, and reduces N fertilization rates to succeeding crops. Forage barley is also harvested 4–8 wk earlier than spring wheat and corn, which enhances more water availability and yield of succeeding crops (Lenssen et al., 2015). A longer duration of fallow between crops can capture precipitation and increase soil water storage as long as soil profile is not saturated and evaporation is lower than the precipitation capture (Farahani et al., 1998; Unger et al., 2006; Nielsen et al., 2010). Another benefit of the rotation system is the reduced infestations of weeds, diseases, and pests, which help to enhance yields compared to monocropping where increased pest in- festations reduces yield. Numerous researchers (Farahani et al., 1998; Johnston et al., 2002; Lenssen et al., 2014, 2018a, 2018b; Schlegel et al., 2017, 2019) have demonstrated increased crop yield with diversified crop rotations compared to continuous monocropping.
Absence of grain in forage barley reduced annualized grain yield with WBP compared to other crop rotations (Table 4). Grain yield, however, was not different among CW, WP, and WBCP, suggesting that crop rotation can sustain grain yield compared to monocropping. Early planting, together with recommended seeding rate, broadcast N fertil- ization, and short stubble height increased grain yield with the tradi- tional management system. Cool-season crops, such as spring wheat, forage barley, and pea, are usually planted early in the semiarid northern Great Plains to take advantage of soil water from snowmelt and grain fill prior to greater drawdown of soil water, enhancing yields. However, crops can be planted late to control delayed emerging weeds by pre-plant herbicide application or tillage if soil water is not a limiting factor for crop production (Anderson, 1999; Lenssen et al., 2014). Near or above-average growing season precipitation increased grain yield in 2005 and 2010 compared to other years. Below normal precipitation reduced aboveground biomass and grain yield in 2008 compared to other years.
The non-significant effect of tillage on annualized aboveground biomass and grain yield was probably due to varying effect of tillage on various crops. From the same experiment, Lenssen et al. (2014, 2015) found that spring wheat yield was greater with no-tillage than conven- tional tillage during dry years, but tillage had varying effect on forage
![]()
![]() Analysis of variance for annualized aboveground biomass and grain N accumulations, aboveground biomass N productivity (BNP), grain N productivity (GNP), aboveground biomass N recovery index (BNRI) and grain N recovery index (GNRI) with tillage (T), crop rotation (C), management system (M) and year (Y) as sources of variance.
Analysis of variance for annualized aboveground biomass and grain N accumulations, aboveground biomass N productivity (BNP), grain N productivity (GNP), aboveground biomass N recovery index (BNRI) and grain N recovery index (GNRI) with tillage (T), crop rotation (C), management system (M) and year (Y) as sources of variance.
![]() Source Above-ground biomass N accumulation (kg N ha—1)
Source Above-ground biomass N accumulation (kg N ha—1)
![]() P values
P values
Grain N accumulation (kg N ha—1)
BNPa (kg ha—1 [kg N ha—1]—1)
GNPa (kg ha—1 [kg N ha—1]—1)
BNRIa (kg N ha—1 [kg N ha—1]—1)
GNRIa (kg N ha—1 [kg N ha—1]—1)
![]()
![]()
T 0.562 0.980 0.789 0.862 0.757 0.908
C < 0.049 < 0.001 < 0.001 < 0.001 < 0.001 < 0.001
T × C 0.603 0.748 0.904 0.944 0.848 0.962
M 0.554 0.064 0.983 0.515 0.688 0.843
T × M 0.880 0.818 0.778 0.921 0.899 0.960
C × M 0.861 0.823 0.935 0.914 0.961 0.974
T × C × M 0.633 0.913 0.742 0.988 0.909 0.987
Y < 0.001 < 0.001 < 0.001 < 0.001 < 0.001 < 0.001
T × Y 0.045 0.901 0.992 0.991 0.790 0.994
C × Y < 0.001 0.215 0.779 0.812 0.559 0.605
T × C × Y 0.995 0.999 1.000 1.000 1.000 1.000
M × Y 0.154 0.772 0.939 0.82 0.927 0.995
T × M × Y 0.971 1.000 0.998 1.000 0.999 1.000
C × M × Y 0.998 1.000 1.000 1.000 1.000 1.000
![]()
T × C × M × Y 1.000 1.000 1.000 0.999 1.000 1.000
![]()
![]()
![]()
 Effect of crop rotation and year on annualized aboveground biomass and grain N accumulations, aboveground biomass N productivity (BNP), grain N productivity (GNP), aboveground biomass N recovery index (BNRI), and grain N recovery index (GNRI).
rotationa
a Crop rotations are CW, continuous spring wheat; WP, spring wheat-pea; WBP, spring wheat-forage barley-pea; and WBCP, spring wheat-forage barley-corm-pea.
b Numbers followed by different letters within a column in a set are significantly different at P = 0.05 by the least square means test.
![]()
![]()
![]()
barley yield in various years. Tillage had no effect on pea yield (Lenssen et al., 2018a), but corn yield was greater in no-tillage than conventional tillage (Lenssen et al., 2018b).
4.2. Soil water storage and water productivity
Reduced crop yield in the previous year likely increased pre-plant soil water storage with CW in 2006 and 2010 (Table 3). However, greater pre-plant soil water storage with increased length of diversified crop rotation from 2007 to 2009 suggests that balanced water use by lower and higher water demanding crops may have better optimized soil water storage with crop rotations. Some researchers (Miller et al., 2003; Lenssen et al., 2018a; Schlegel et al., 2017) have observed greater pre-plant soil water storage with diversified crop rotations than continuous monocropping. Reduction in water use by weeds due to efficient weed control from pre-plant herbicide application during late planting and two to three weeks longer time in the spring to capture precipitation, followed by increased soil water conservation due to tall stubble probably increased pre-plant soil water storage with the alter- nate management system. Taller stubble can decrease evaporation loss and increase preplant soil water storage compared to shorter stubble (Black and Siddoway, 1977; Aase and Siddoway, 1980). Over six years, soil water storage at planting under spring wheat was 31 mm greater in the alternate than the traditional management system (Lenssen et al., 2014). Pre-plant soil water storage plays an important role in the per- formance of dryland crops (Nielsen et al., 2005; Unger et al., 2006; Schlegel et al., 2017).
Efficient water use by previous crop likely reduced postharvest soil water storage with WBCP in 2005, 2006, and 2010 (Table 3) when the growing season precipitation was near or above the normal (Fig. 1). As discussed above, high water demanding crops were grown alternately with low water demanding crops in WBCP. This may have resulted in reduced water use by crops, resulting in increased postharvest soil water storage with WBCP during wet years.
Increased preplant soil water storage and growing season precipita- tion, followed by reduced postharvest soil water storage resulted in greater crop water use with CW in 2006 and 2010 (Table 3) when the growing season precipitation was above the 30-yr average (Fig. 1). In contrast, increased preplant soil water storage increased crop water use with WBCP in 2007 when the growing season precipitation was below the average. This suggests that diversified crop rotation can enhance water use compared to monocropping during dry years, but mono- cropping can do so during wet years. It would not be surprising to observe high water use with CW due to the presence of high water demanding crop, such as spring wheat, in every year. Greater water uptake due to increased seeding rate, banded N fertilization, late
planting, and tall stubble increased crop water use in the alternate management system in 2009 when the growing season precipitation was below the normal.
Increased aboveground biomass but non-different or lower crop water use increased BWP with WBP and WBCP in 2005, 2008, 2009, and 2010 (Table 3). In contrast, non-different aboveground biomass, but lower water use increased BWP with WBP and WBCP in 2006. This suggests that diversified crop rotations used water more efficiently and increased water productivity compared to continuous monocropping either by increasing crop yields or decreasing water use. Increased water-use efficiency with diversified crop rotations compared to continuous monocroping has been reported by several researchers (Lenssen et al., 2018a; Schlegel et al., 2017).
Lower crop water use but non-different grain yield also increased GWP with WBCP in 2006 (Table 3). In contrast, greater grain yield, but non-different water use likely increased GWP with CW and WP in 2009. Absence of grain reduced GWP with WBP in both years. Increased grain yield, but non-different water use also increased GWP in the traditional than the alternate-year management system (Table 4). This suggests that early planting, broadcast N fertilization, recommended seeding rate, and short stubble increased grain water productivity in the traditional practice due to increased crop yield.
As with annualized crop yield, the variable effect of tillage on pre- plant and postharvest soil water storage, water use, and water produc- tivity under individual crops probably resulted in the non-significant effect of tillage on these parameters for the rotation system. Our re- sults are dissimilar to those reported by some researchers (Hatfield et al., 2001; Nielsen et al., 2005; Unger et al., 2006), who reported that soil water storage, water use, and water-use efficiency were greater with no-tillage than conventional tillage under dryland cropping systems. Differences in soil and climatic conditions among regions and tillage depth may have resulted in variable effect of tillage on these parameters. Our tillage depth was 8 cm compared to 15–20 cm depth in other re- gions, which may have affected evapotranspiration due to differences in soil disturbance and crop residue accumulation. Furthermore, our re- gion receives 50–100 mm less precipitation than the central and southern Great Plains where the above researchers conducted their experiments.
Although pea and forage barley were land rolled after planting, land rolling was not done for spring wheat and corn in all rotations. Land rolling decreased pea yield (Olson et al., 2004; Lenssen, 2009), but did not influence pea water use (Lenssen, 2009), and spring wheat yield and water use (Lenssen and Sainju, 2019). These studies suggest that land rolling had minimum impact on crop yield and water use.
Growing season precipitation near or above the average (Fig. 1) increased preplant and postharvest soil water, crop water use, BWP, and
![]()
![]()
![]()
GWP in 2005, 2006, and 2007. In contrast, below-average precipitation decreased these parameters in 2008. This suggest that precipitation has a large influence on soil water storage and crop water productivity in dryland cropping systems.
4.3. Nitrogen accumulation and productivity
As tillage did not affect annualized aboveground biomass, differ- ences in N concentration for individual crops probably resulted in var- iations in aboveground biomass N accumulation between tillage treatments in various years. The greater aboveground biomass N accu- mulation in no-tillage than conventional tillage in 2005 (Table 5) was due to increased N concentration in aboveground biomass of forage barley and pea in that year (Table 8). In contrast, the greater biomass N accumulation in conventional tillage than no-tillage in 2007 and 2010 was due to increased aboveground biomass N concentration in forage barley and spring wheat in 2007 and in forage barley, corn, and pea in 2010. Increased biomass N accumulation with WBCP in 2005 was due to increased aboveground biomass (Table 3). Similarly, increased biomass N accumulation with WP in 2010 was due to increased aboveground biomass (Table 3) and greater N concentration in pea and spring wheat aboveground biomass with WP in that year (Table 8). Increased grain N accumulation with WP compared to other crop rotations (Table 7) was due to greater grain yield (Table 4) and pea N concentration (Table 9). Similarly, increased grain N accumulation in 2007 and 2009 (Table 7) was due to greater pea N concentration in 2009 and spring wheat N concentration in 2007 (Table 9).
Increased BNP with WP, WBP, and WBCP compared to CW (Table 7) was due to greater annualized aboveground biomass (Table 4), but lower amount of N fertilizer applied to crops in the rotations due to N supplied by pea. Nitrogen availability to spring wheat, forage barley,
Nitrogen concentration in aboveground biomass of forage barley, corn, pea, and spring wheat as affected by tillage and crop rotation from 2005 to 2010.
Nitrogen concentration in grain of corn, pea, and spring wheat grain as affected by crop rotation and year.
Crop rotationa Year Grain N concentration (g N kg—1)
![]()
![]() Corn Pea Spring wheat
Corn Pea Spring wheat
WBCP 16.1
WP 40.8ab
WBP 40.0b
WBCP 40.9a
CW 29.2a
WP 27.6b
WBP 26.7c
WBCP 27.5b
2005 |
16.7 |
34.2d |
24.8c |
2006 |
15.7 |
40.3c |
30.4a |
2007 |
16.3 |
39.8c |
29.8ab |
2008 |
16.5 |
43.0b |
30.1a |
2009 |
16.5 |
45.4a |
28.9b |
2010 |
16.0 |
40.0c |
22.5d |
a Crop rotations are CW, continuous spring wheat; WP, spring wheat-pea; WBP, spring wheat-forage barley-pea; and WBCP, spring wheat-forage barley- corm-pea.
b Numbers followed by different letters within a column in a set are signifi-
cantly different at P = 0.05 by the least square means test.
corn, and pea were 101, 67, 78, and 6 kg N ha—1, respectively. As a result, available N for CW, WP, WBP, and WBCP were 101, 54, 58, and
63 kg N ha—1, respectively after accounting for N credit from pea res-
idue. Similarly, increased GNP with WP compared to other rotations (Table 7) was due to increased annualized grain yield (Table 4), but lower available N. The greater BNRI and GNRI with WP than other crop rotations, except for BNRI with WBP (Table 7), were also due to increased aboveground biomass and grain N accumulations, but lower available N. These results suggest that diversified crop rotations used N more efficiently in aboveground biomass than continuous monocrop- ping. Similarly, spring wheat-pea rotation used N more efficiently in grain and removed more N in aboveground biomass and grain than other
![]()
Tillagea Crop
Aboveground biomass N concentration (g N kg—1)
crop rotations. Allen et al. (2016) reported that diversified crop rotation
rotationb
2005 2006 2007 |
2008 |
2009 |
2010 |
|||
Forage barley CT 17.4bc 15.1b 15.5a |
27.0 |
21.0a |
19.4a |
|||
NT |
23.9a |
17.5a |
13.8b |
25.4 |
18.5b |
17.6b |
CT |
Corn 11.0 |
9.5 |
7.3 |
11.7 |
11.4 |
20.7a |
NT |
10.0 |
9.7 |
8.2 |
11.3 |
10.0 |
18.7b |
Pea
CT 12.4b 15.1b
NT 13.7a 16.4a
removed more N than monocropping.
The fact that tillage and management system did not affect grain N accumulation, BNP, GNP, BNRI, and GNRI suggests that these man- agement practices had little impact on N relations. Crop rotation was the dominant treatment that influenced not only N relations, but also crop yield, water use, and water productivity.
 Similar to soil water and crop water productivity, greater above- ground biomass and grain N accumulations, BNP, GNP, BNRI, and GNRI
Spring wheat
CT 9.0 14.7
![]()
![]()
WBP 19.8 16.8 14.3 26.5 19.7 17.4
WBCP 21.5 15.8 15.0 25.9 19.7 19.6
Corn
WBCP 10.0 9.6 7.8 11.5 10.7 19.7
Pea
WP 14.9a 15.5b 17.4 19.7a 26.4ab 19.2a WBP 11.8b 14.6b 16.7 15.9b 25.4b 19.8a WBCP 13.1b 17.1a 16.4 19.1a 27.7a 10.7b
Spring wheat
CW 10.1a 14.1 10.0 17.0a 20.0a 20.1c WP 8.2b 14.7 9.1 14.2b 19.2ab 26.8ab WBP 8.9ab 14.2 10.5 14.3b 17.4b 25.5b WBCP 8.3b 14.5 9.7 14.7b 19.6ab 27.7a
![]()
a Tillage are CT, conventional tillage; and NT, no-tillage.
b Crop rotations are CW, continuous spring wheat; WP, spring wheat-pea; WBP, spring wheat-forage barley-pea; and WBCP, spring wheat-forage barley- corm-pea.
c Numbers followed by different letters within a column in a set are signifi-
cantly different at P = 0.05 by the least square means test.
Crop rotation had stronger impact on annualized aboveground biomass, grain yield, soil water storage, crop water use, and water and N productivity compared to tillage and management system in dryland cropping systems in the northern Great Plains, USA. Aboveground biomass, pre-plant and postharvest soil water storage, and BWP were greater with WBCP, but water use, grain N accumulation, GNP, and GNRI were greater with WP than other crop rotations. The effect of crop rotation on soil water storage and water use was more pronounced in years with normal or above-average precipitation. Absence of grain production with forage barley reduced annualized grain yield, pre-plant and postharvest soil water storage, water use, grain N accumulation, GNP, and GNRI with WBP. Tillage and management system had variable effect on water use and aboveground biomass N accumulation in various years. Traditional management increased grain yield and GWP, but the alternate management increased preplant soil water storage. Diversified
![]()
![]()
![]()
crop rotations with increased length of the rotation increased annualized crop yield, soil water storage, and water productivity, but a two-year rotation of legume-nonlegume increased water use and N relations compared to other crop rotations in dryland cropping systems.
Declaration of Competing Interest
The authors declare that they have no known competing financial interests or personal relationships that could have appeared to influence the work reported in this paper.
The authors gratefully acknowledge expert assistance from Bill Iversen, Joy Barsotti, Rene’ France, Mark Gaffri, and Michael Johnson over the course of this study. Mention of trade names or commercial products in this publication is solely for the purpose of providing specific information and does not imply recommendation or endorsement by USDA. The USDA is an equal opportunity employer.
Aase, J.K., Siddoway, F.H., 1980. Stubble height effects on seasonal microclimate, water balance, and plant development of no-till winter wheat. Agric. Meteor. 21, 1–20. https://doi.org/10.1016/0002-1571(80)90065-5.
Allen, B.L., Lenssen, A.W., Sainju, U.M., Jabro, J.D., Stevens, W.B., 2016. Nitrogen use in barley hay influenced by crop diversification, tillage, and management. In: Osborne,
S. (Ed.), Proc. Great Plains Soil Fertility Conference, March 1–2, 2016. Denver, CO. International Plant Nutrition Institute, Brookings, SD, pp. 172–179.
Anderson, R.L., 1999. Cultural strategies reduce weed densities in summer annual crops.
![]() Weed Technol. 13, 314–319. https://doi.org/10.1017/S0890037 00041798.
Weed Technol. 13, 314–319. https://doi.org/10.1017/S0890037 00041798.
Anderson, R.L., 2005. A multi-tactic approach to manage weed population dynamics in crop rotations. Agron. J. 97, 1579–1583. https://doi.org/10.2134/agronj2005.0194.
Black, A.L., Siddoway, F.H., 1977. Winter wheat recropping on dryland as affected by stubble height and nitrogen fertilization. Soil Sci. Soc. Am. J. 41, 1186–1190. https://doi.org/10.2136/sssaj1977.03615995004100060035x.
Chanasyk, D.S., Naeth, M.A., 1996. Field measurement of soil moisture using neutron probes. Can. J. Plant Sci. 76, 317–323. https://doi.org/10.4141/cjss96-038.
DeFelice, M.S., Carter, P.R., Mitchell, S.B., 2006. Influence of tillage on corn and soybean yields in the United States and Canada. Crop Manage. https://doi.org/10.1094/CM- 2006-0626-01-RS https://doi.org/10.1094/CM-2006-0626-01-RS.
Farahani, J.J., Peterson, G.A., Westfall, D.G., 1998. Dryland cropping intensification: a fundamental solution to efficient use of precipitation. Adv. Agron. 64, 197–233. https://doi.org/10.1016/S0065-2113(08)60505-2.
Hatfield, J.L., Sauer, T.J., Prueger, J.H., 2001. Managing soils to achieve greater water- use efficiency: a review. Agron. J. 93, 271–280. https://doi.org/10.2134/ agronj2001.932271x.
Johnston, A.M., Tanaka, D.L., Miller, P.R., Brandt, S.A., Nielsen, D.C., Lafond, G.P., Riveland, N.R., 2002. Oilseed crops for semiarid cropping systems in the northern Great Plains. Agron. J. 94, 231–240. https://doi.org/10.2134/agronj2002.2310.
Katsvairo, T.W., Cox, W.J., 2000. Economics of cropping systems featuring different rotations, tillage, and management. Agron. J. 92, 485–493. https://doi.org/ 10.2134/agronj2000.923485x.
Lafond, G.P., May, W.E., Stevenson, F.C., Derksen, D.A., 2006. Effect of tillage system and rotation on crop production for a thin Black Chernozem in the Canadian Prairies. Soil Tillage Res. 89, 232–245. https://doi.org/10.1016/j.still.2005.07.014.
Lenssen, A.W., 2009. Effect of land rolling on weed emergence in field pea, barley, and fallow. Weed Technol. 23, 23–27. https://doi.org/10.1614/WT-08-023.1.
Lenssen, A.W., Cash, S.D., 2011. Annual warm-season grasses vary for forage yield, quality, and competitiveness with weeds. Arch. Agron. Soil Sci. 57, 839–852. https://doi.org/10.1080/03650340.2010.498012.
Lenssen, A.W., Sainju, U.M., 2019. Land rolling does not influence productivity of subsequent-year spring wheat. Crop Forage Turfgrass Manag. 5, 190024 https://doi. org/10.2134/cftm2019.04.0024 https://doi.org/10.2134/cftm2019.04.0024.
Lenssen, A.W., Sainju, U.M., Iversen, W.M., Allen, B.L., Evans, R.G., 2014.
Diversification, tillage, and management influence spring wheat yield and water use. Agron. J. 106, 1445–1454. https://doi.org/10.2134/agronj14.0119.
Lenssen, A.W., Sainju, U.M., Jabro, J.D., Allen, B.L., Evans, R.G., 2015. Management and tillage system influence forage barley productivity and water use in dryland cropping systems. Agron. J. 107, 551–557. https://doi.org/10.2134/agronj14.0421.
Lenssen, A.W., Sainju, U.M., Jabro, J.D., Allen, B.L., Stevens, W.B., 2018a. Dryland pea productivity and soil water responses to tillage, crop rotation, and weed management practice. Agron. J. 110, 1843–1853. https://doi.org/10.2134/ agronj2018.03.0182.
Lenssen, A.W., Sainju, U.M., Jabro, J.D., Allen, B.L., Stevens, W.B., 2018b. Dryland corn production and water use affected by tillage and crop management intensity. Agron. J. 110, 2439–2446. https://doi.org/10.2134/agronj2018.04.0267.
Littell, R.C., Milliken, G.A., Stroup, W.W., Wolfinger, R.D., Schabenberger, O., 2006. SAS for Mixed Models. SAS Inst. Inc., Cary, NC.
Machado, S., Petrie, S., Rhinhart, K., Ramig, R.E., 2008. Tillage effects on water use and grain yield of winter wheat and green pea in rotation. Agron. J. 100, 154–162. https://doi.org/10.2134/agronj2006.0218.
Major, D.J., Morrison, R.J., Blackshaw, R.E., Roth, B.T., 1991. Agronomy of dryland corn production at the northern fringe of the Great Plains. J. Prod. Agric. 4, 606–613. https://doi.org/10.2134/jpa1991.0606.
Meyer-Aurich, A., Janovicek, K., Dean, W., Weersink, A., 2006. Impact of tillage and rotation on yield and economic performance in corn-based cropping systems. Agron. J. 98, 1204–1212. https://doi.org/10.2134/agronj2005.0262.
Miller, P.R., Gan, Y., McConkey, B.G., McDonald, C.L., 2003. Pulse crops for the northern Great Plains: I. Grain productivity and residual effects on soil water and nitrogen. Agron. J. 95, 972–979. https://doi.org/10.2134/agronj2003.9720.
Nichols, V., Verhulst, N., Cox, R., Govaerts, B., 2015. Weed dynamics and conservation agriculture principles: a review. Field Crops Res. 183, 56–68. https://doi.org/ 10.1016/j.fcr.2015.07.012.
Nielsen, D.C., Halvorson, A.D., Vigil, M.F., 2010. Critical precipitation period for dryland maize production. Field Crops Res. 118, 259–263. https://doi.org/10.1016/j. fcr.2010.06.004.
Nielsen, D.C., Unger, P.W., Miller, P.R., 2005. Efficient water use in dryland cropping systems in the Great Plains. Agron. J. 97, 364–372. https://doi.org/10.2134/ agronj2005.0364.
Olson, M., Lopetinsky, K., Winchell, W., Sauchuk, C., 2004. Land rolling guidelines for pulse crops in western Canada. Agdex 142/21–1. Manitoba, Saskatchewan, and Alberta Agriculture, Food, and Rural Development. https://www1.agric.gov.ab.ca/
$department/deptdocs.nsf/all/agdex8817. (Accessed 12 February 2019).
Payne, W.A., Rasmussen, P.E., Chen, C., Ramig, R.E., 2001. Addressing simple wheat and pea models using data from a long-term tillage experiment. Agron. J. 93, 250–260. https://doi.org/10.2134/agronj2001.931250x.
Ruisi, P., Giambalvo, D., Miceli, G.D., Frenda, A.S., Saria, S., Amato, G., 2012. Tillage effects on yield and nitrogen fixation of legumes in Mediterranean conditions. Agron. J. 104, 1459–1466. https://doi.org/10.2134/agronj2012.0070.
Sainju, U.M., Caesar-TonThat, T., Lenssen, A.W., Evans, R.G., 2009. Dryland crop yields and soil organic matter as influenced by long-term tillage and cropping sequence. Agron. J. 101, 243–251. https://doi.org/10.2134/agronj2008.0080x.
Sainju, U.M., Lenssen, A.W., Allen, B.L., Jabro, J.D., Stevens, W.B., 2019. Pea growth, yield, and quality in different crop rotations and cultural practices. Agrosyst. Geosci. Environ. 2, 1–9. https://doi.org/10.2134/age2018.10.0041.
Schlegel, A.J., Assefa, Y., Haag, L.A., Thompson, C.R., Holman, J.D., Stone, L.R., 2017. Yield and soil water in three dryland wheat and grain sorghum rotations. Agron. J. 109, 227–238. https://doi.org/10.2134/agronj2016.07.0387.
Schlegel, A.J., Assefa, Y., Haag, L.A., Thompson, C.R., Holman, J.D., Stone, L.R., 2019. Soil water and water use in long-term dryland crop rotations. Agron. J. 111, 1–10. https://doi.org/10.2134/agronj2018.09.0623.
Singer, J.W., Cox, W.J., 1998. Agronomics of corn production under different crop rotations in New York. J. Prod. Agric. 11, 462–468. https://doi.org/10.2134/ jpa1998.0462.
Strydhorst, S.M., King, J.R., Lopetinsky, K.H., Harker, K.N., 2008. Weed interference, pulse species, and plant density effects on rotational benefits. Weed Sci. 56, 249–258. https://doi.org/10.1614/WS-07-118.1.
Tompkins, D.K., Fowler, D.B., Wright, A.T., 1991. Water use by no-till winter wheat influenced by seed rate and row spacing. Agron. J. 83, 766–769. https://doi.org/ 10.2134/agronj1991.00021962008300040022x.
Unger, P.W., Payne, W.A., Peterson, G.A., 2006. Water conservation and efficient use. In: Peterson, G.A., Unger, P.W., Payne, W.A. (Eds.), Dryland Agriculture, second ed. Agron. Monograph. 23. ASA, CSSA, and SSSA, Madison, WI, pp. 39–85. https://doi. org/10.2134/agronmonogr23.2ed.c3.
Vetsch, J.A., Randall, G.W., 2002. Corn production as affected by tillage systems and starter fertilizer. Agron. J. 94, 532–540. https://doi.org/10.2134/agronj2002.5320.
![]()